张量分解之 代码实现篇(持续更新)
奇异值分解及图像应用
若果想知道特征值,奇异值的介绍,数学原理,推导等等。。猛戳这里~~

上代码
import numpy as np

# 实对称矩阵A
A = np.array([[1, 2, 3],
              [2, 4, 5],
              [3, 5, 6]])
print('A shape: {}'.format(A.shape))

# 计算A的特征值和特征向量
eig_values, U = np.linalg.eig(A)
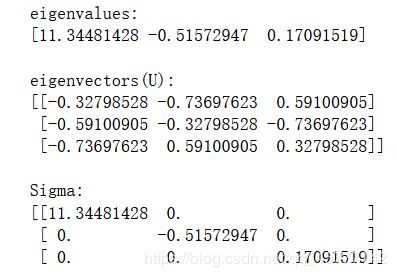
print("eigenvalues:\n{}\n".format(eig_values))
print("eigenvectors(U):\n{}\n".format(U))

# 用特征值构建特征矩阵\Sigma
Sigma = np.diag(eig_values)
print("Sigma:\n{}\n".format(Sigma))
# 验证分解是否正确
print(U.dot(Sigma).dot(U.T))   #完美!
返回结果证明了我们特征值分解是正确的的!

接下来是奇异值分解的算法:

# 实数矩阵A
A = np.array([[1, 2, 3],
              [4, 5, 6],
              [7, 8, 9],
              [10, 11, 12]])
print('A shape: {}'.format(A.shape))

# 奇异值分解
U, svd_values, V_T = np.linalg.svd(A)

# 用奇异值构建奇异值矩阵\Sigma
Sigma = np.zeros_like(A, np.float64)
for i in range(svd_values.shape[0]):
    Sigma[i, i] = svd_values[i]
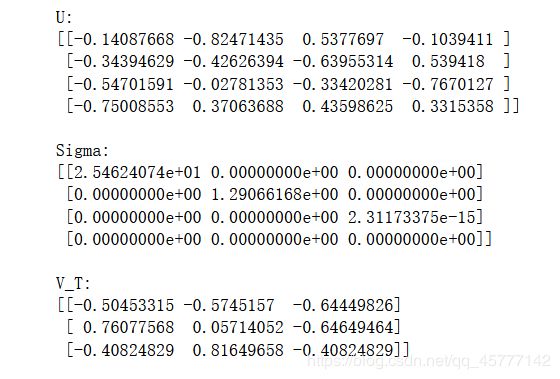
print("U:\n{}\n".format(U))
print("Sigma:\n{}\n".format(Sigma))
print("V_T:\n{}\n".format(V_T))
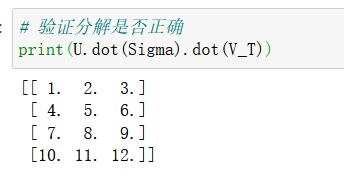
# 验证分解是否正确
print(U.dot(Sigma).dot(V_T))
下面应用到图像中的压缩处理:
import matplotlib.pyplot as plt
import matplotlib.image as mpimg
%matplotlib inline
import cv2

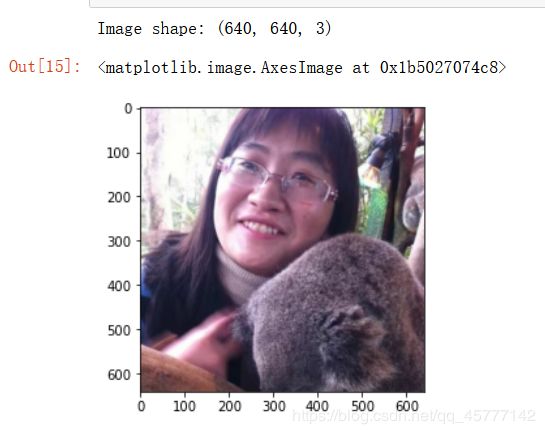
image = mpimg.imread('hhh.png')
print('Image shape: {}'.format(image.shape))
plt.imshow(image)
# 像将三维图像reshape成两维,再进行奇异值分解
image_reshaped = image.reshape(image.shape[0], -1)
print('Reshaped image shape:\t{}'.format(image_reshaped.shape))
# 先svd分解,再根据提供的特征数量重构
def rebuild(A, n_features):
    U, svd_values, V_T = np.linalg.svd(A)
    return (U[:, :n_features]).dot(np.diag(svd_values[:n_features])).dot(V_T[:n_features, :])
设置不同参数K,迭代算法:
features = [10, 20, 50, 100, 300]
_, axarr = plt.subplots(1, len(features)+1, figsize=((len(features)+1)*5, 5))
axarr[0].imshow(image)
axarr[0].set_title('Original image')
for i, n_features in enumerate(features):
    rebuilded_image = rebuild(image_reshaped, n_features).reshape(*image.shape)
    rebuilded_image = np.clip(rebuilded_image, 0, 1)
    axarr[i+1].imshow(rebuilded_image)
    axarr[i+1].set_title('n_features: {}'.format(n_features))


