数据挖掘之用户画像
目录:
- 一. 构造词向量特征
- 1.1 原始数据编码转换
- 1.2 生成对应的数据表
- 1.3 分词与词性过滤
- 二. 构造输入特征
- 2.1 使用Gensim库建立word2vec词向量模型
- 2.2 加载训练好的word2vec模型,求用户搜索结果的平均向量
- 2.3 测试集
- 三. 建立预测模型
- 3.1 基础预测模型(逻辑回归)
- 3.2 随机森林
- 3.3 堆叠模型
- 四. 模型测试
一. 构造词向量特征
1.1 原始数据编码转换
import pandas as pd
import csv

# 训练数据
data_path = r'data\user_tag_query.10W.TRAIN'
csvfile = open(data_path + '-1w.csv', 'w')
writer = csv.writer(csvfile)
writer.writerow(['ID', 'age', 'Gender', 'Education', 'QueryList'])
with open(data_path, 'r', encoding = 'gb18030', errors = 'ignore') as f:
    lines = f.readlines()
    for line in lines[0: 10000]:
        try:
            line.strip()
            data = line.split('\t')
            writedata = [data[0], data[1], data[2], data[3]]
            querystr = ''
            data[-1] = data[-1][:-1]
            for d in data[4:]:
                try:
                    cur_str = d.encode('utf8')
                    cur_str = cur_str.decode('utf8')
                    querystr += cur_str + '\t'
                except:
#                    print(data[0][0:10])
                    continue
            querystr = querystr[:-1]
            writedata.append(querystr)
            writer.writerow(writedata)
        except:
#            print(data[0][0:20])
            continue

# 测试数据
data_path = r'data\user_tag_query.10W.TEST'
csvfile = open(data_path + '-1w.csv', 'w')
writer = csv.writer(csvfile)
writer.writerow(['ID', 'age', 'Gender', 'Education', 'QueryList'])
with open(data_path, 'r', encoding = 'gb18030', errors = 'ignore') as f:
    lines = f.readlines()
    for line in lines[0: 10000]:
        try:
            line.strip()
            data = line.split('\t')
            writedata = [data[0], data[1], data[2], data[3]]
            querystr = ''
            data[-1] = data[-1][:-1]
            for d in data[4:]:
                try:
                    cur_str = d.encode('utf8')
                    cur_str = cur_str.decode('utf8')
                    querystr += cur_str + '\t'
                except:
                    #print(data[0][0:10])
                    continue
            querystr = querystr[:-1]
            writedata.append(querystr)
            writer.writerow(writedata)
        except:
            #print(data[0][0:20])
            continue

trainname = r'data\user_tag_query.10W.TRAIN-1w.csv'
testname = r'data\user_tag_query.10W.TEST-1w.csv'
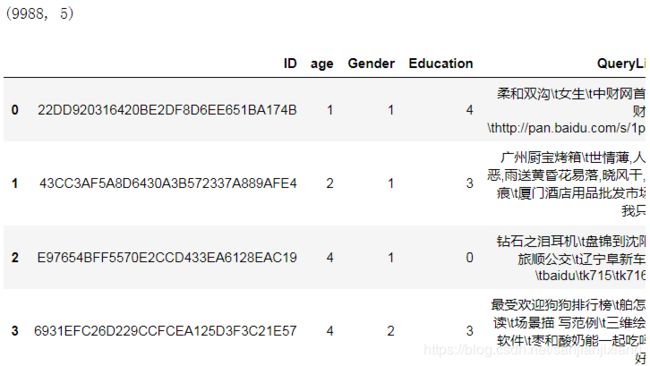
data = pd.read_csv(trainname, encoding = 'gbk')
print(data.shape)
data.head()
1.2 生成对应的数据表
data.age.to_csv(r'data\train_age.csv', index = False)
data.Gender.to_csv(r'data\train_gender.csv', index = False)
data.Education.to_csv(r'data\train_education.csv', index = False)
data.QueryList.to_csv(r'data\train_querylist.csv', index = False)

data = pd.read_csv(testname, encoding = 'gbk')
data.QueryList.to_csv(r'data\test_querylist.csv', index = False)
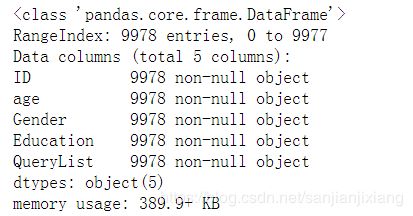
data.info()
1.3 分词与词性过滤
import numpy as np
import jieba.analyse
import time
import jieba
import jieba.posseg
import os, sys

def input(trainname):
    traindata = []
    with open(trainname, 'rb') as f:
        line = f.readline()
        count = 0
        while line:
            try:
                traindata.append(line)
                count += 1
            except:
                print('error:', line, count)
            line = f.readline()
    return traindata
start = time.clock()

filepath = r'data\train_querylist.csv'
QueryList = input(filepath)

writepath = r'data\train_querylist_writefile-1w.csv'
csvfile = open(writepath, 'w')

Pos = {}
for i in range(len(QueryList)):
    if i % 2000 == 0 and i >= 1000:
        print(i, 'finished')
    s = []
    str = ''
    words = jieba.posseg.cut(QueryList[i]) # 带有词性的精确分词模式
    allowPos = ['n', 'v', 'j']
    for word, flag in words:
        Pos[flag] = Pos.get(flag, 0) + 1
        if (flag[0] in allowPos) and len(word) >= 2:
            str += word + ' '

    cur_str = str.encode('utf8')
    cur_str = cur_str.decode('utf8')
    s.append(cur_str)

    csvfile.write(' '.join(s) + '\n')
csvfile.close()

end = time.clock()
print('Totle time: %f s' % (end - start))
Totle time: 659.842879 s
二. 构造输入特征
2.1 使用Gensim库建立word2vec词向量模型
from gensim.models import word2vec
train_path = r'F:\51学习\study\数据挖掘案例\用户画像\data\train_querylist_writefile-1w.csv'
with open(train_path, 'r') as f:
    My_list = []
    lines = f.readlines()
    for line in lines:
        cur_list = []
        line = line.strip()
        data = line.split(' ')
        for d in data:
            cur_list.append(d)
        My_list.append(cur_list)
    model = word2vec.Word2Vec(My_list, size = 300, window = 10, workers = 4)
    savepath = '1w_word2vec_' + '300' + '.model' # 保存model的路径
    model.save(savepath)
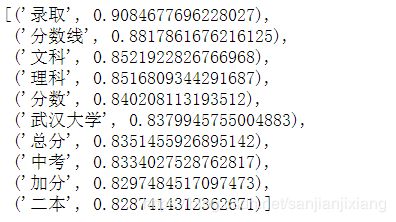
model.most_similar('高考')
2.2 加载训练好的word2vec模型,求用户搜索结果的平均向量
file_name = r'F:\51学习\study\数据挖掘案例\用户画像\data\train_querylist_writefile-1w.csv'
cur_model = word2vec.Word2Vec.load('1w_word2vec_300.model')
with open(file_name, 'r') as f:
    cur_index = 0
    lines = f.readlines()
    doc_cev = np.zeros((len(lines), 300))
    for line in lines:
        word_vec = np.zeros((1, 300))
        words = line.strip().split(' ')
        word_num = 0
        for word in words:
            if word in cur_model:
                word_num += 1
                word_vec += np.array([cur_model[word]])
        doc_cev[cur_index] = word_vec / float(word_num)
        cur_index += 1

doc_cev.shape
# doc_cev[5]
(9988, 300)
genderlabel = np.loadtxt(open(r'data\train_gender.csv', 'r')).astype(int)
educationlabel = np.loadtxt(open(r'data\train_education.csv', 'r')).astype(int)
agelabel = np.loadtxt(open(r'data\train_age.csv', 'r')).astype(int)
print(genderlabel.shape, educationlabel.shape, agelabel.shape)

def removezero(x, y):
    nozero = np.nonzero(y)
    y = y[nozero]
    x = np.array(x)
    x = x[nozero]
    return x, y
gender_train, genderlabel = removezero(doc_cev, genderlabel)
age_train, agelabel = removezero(doc_cev, agelabel)
education_train, educationlabel = removezero(doc_cev, educationlabel)
print(gender_train.shape, genderlabel.shape)
print(age_train.shape, agelabel.shape)
print(education_train.shape, educationlabel.shape)
(9988,) (9988,) (9988,)
(9756, 300) (9756,)
(9815, 300) (9815,)
(9064, 300) (9064,)
2.3 测试集
file_name = r'data\test_querylist_writefile-1w.csv'
cur_model = word2vec.Word2Vec.load('1w_word2vec_300.model')
with open(file_name, 'r') as f:
    cur_index = 0
    lines = f.readlines()
    doc_cev = np.zeros((len(lines), 300))
    for line in lines:
        word_vec = np.zeros((1, 300))
        words = line.strip().split(' ')
        word_num = 0
        for word in words:
            if word in cur_model:
                word_num += 1
                word_vec += np.array([cur_model[word]])
        doc_cev[cur_index] = word_vec / float(word_num)
        cur_index += 1
print(doc_cev.shape)
doc_cev[5]
三. 建立预测模型
3.1 基础预测模型(逻辑回归)
from sklearn.linear_model import LogisticRegression
from sklearn.model_selection import train_test_split
from sklearn.metrics import confusion_matrix
import matplotlib.pyplot as plt
%matplotlib inline

X_train, X_test, y_train, y_test = train_test_split(gender_train, genderlabel, test_size = 0.25, random_state = 42)

Lr_model = LogisticRegression()
Lr_model.fit(X_train, y_train)
y_pred = Lr_model.predict(X_test)
print(Lr_model.score(X_test, y_test))

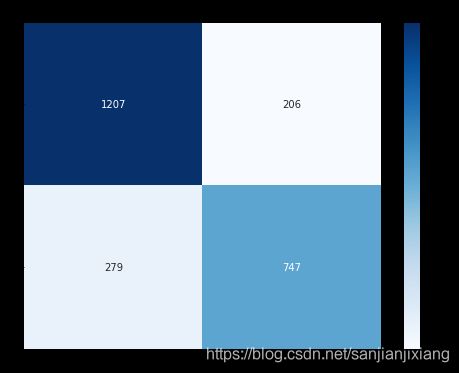
cnf_matrix = confusion_matrix(y_test, y_pred)
print('Recall metric in the testing dataset: ', cnf_matrix[1, 1] / (cnf_matrix[1, 0] + cnf_matrix[1, 1]))
print('Accuracy metric in the testing dataset: ', (cnf_matrix[1, 1] + cnf_matrix[0, 0]) / (cnf_matrix[0, 0] + cnf_matrix[0, 1]
                                                                                           + cnf_matrix[1, 0] + cnf_matrix[1, 1]))
import seaborn as sns
plt.figure(figsize = (8, 6))
sns.heatmap(cnf_matrix, annot = True, fmt = 'd', cmap = 'Blues')
plt.title('Gender-Confusion matrix')
0.8011480114801148
Recall metric in the testing dataset: 0.7280701754385965
Accuracy metric in the testing dataset: 0.8011480114801148

3.2 随机森林
from sklearn.ensemble import RandomForestClassifier

rfc_model = RandomForestClassifier(n_estimators = 100, min_samples_split = 5, max_depth = 10)
rfc_model.fit(X_train, y_train)
y_pred = rfc_model.predict(X_test)
print(rfc_model.score(X_test, y_test))

rfc_matrix = confusion_matrix(y_test, y_pred)
print('Recall metric in the testing dataset: ', rfc_matrix[1, 1] / (rfc_matrix[1, 0] + rfc_matrix[1, 1]))
print('Accuracy metric in the testing dataset: ', (rfc_matrix[1, 1] + rfc_matrix[0, 0]) / (rfc_matrix[0, 0] + rfc_matrix[0, 1]
                                                                                           + rfc_matrix[1, 0] + rfc_matrix[1, 1]))
plt.figure(figsize = (8, 6))
sns.heatmap(rfc_matrix, annot = True, fmt = 'd', cmap = 'Blues')
plt.title('Gender-Confusion matrix')
0.8031980319803198
Recall metric in the testing dataset: 0.7348927875243665
Accuracy metric in the testing dataset: 0.8031980319803198

3.3 堆叠模型
from sklearn.svm import SVC
from sklearn.naive_bayes import MultinomialNB
clf1 = RandomForestClassifier(n_estimators=100,min_samples_split=5,max_depth=10)
clf2 = SVC()
clf3 = LogisticRegression()
basemodes = [['rf', clf1], ['svm', clf2], ['lr', clf3]]

from sklearn.model_selection import KFold, StratifiedKFold
models = basemodes

folds = KFold(n_splits=5, random_state=42)

S_train = np.zeros((X_train.shape[0], len(models)))
S_test = np.zeros((X_test.shape[0], len(models)))

for i, bm in enumerate(models):
    clf = bm[1]

    for train_idx, test_idx in folds.split(X_train):
        X_train_cv = X_train[train_idx]
        y_train_cv = y_train[train_idx]
        X_val = X_train[test_idx]
        clf.fit(X_train_cv, y_train_cv)
        y_val = clf.predict(X_val)[:]

        S_train[test_idx, i] = y_val
    S_test[:,i] = clf.predict(X_test)

final_clf = RandomForestClassifier(n_estimators=100)
final_clf.fit(S_train,y_train)

print (final_clf.score(S_test,y_test))
0.8056580565805658
四. 模型测试
file_name = r'data\train_querylist_writefile-1w.csv'
cur_model = word2vec.Word2Vec.load('1w_word2vec_300.model')
with open(file_name, 'r') as f:
    cur_index = 0
    lines = f.readlines()
    doc_cev = np.zeros((len(lines), 300))
    for line in lines:
        word_vec = np.zeros((1, 300))
        words = line.strip().split(' ')
        word_num = 0
        for word in words:
            if word in cur_model:
                word_num += 1
                word_vec += np.array([cur_model[word]])
        doc_cev[cur_index] = word_vec / float(word_num)
        cur_index += 1
print(doc_cev.shape)

genderlabel = np.loadtxt(open(r'data\train_gender.csv', 'r')).astype(int)
genderlabel.shape
(9988, 300)
(9988,)
def removezero(x, y):
    nozero = np.nonzero(y)
    y = y[nozero]
    x = np.array(x)
    x = x[nozero]
    return x, y

gender_train, genderlabel = removezero(doc_cev, genderlabel)
print(gender_train.shape, genderlabel.shape)
(9756, 300) (9756,)
# 绘制混淆矩阵
import itertools
def plot_confusion_matrix(cm, classes, title = 'Confusion matrix', cmap = plt.cm.Blues):
    plt.imshow(cm, interpolation = 'nearest', cmap = cmap)
    plt.title(title)
    plt.colorbar()
    tick_marks = np.arange(len(classes))
    plt.xticks(tick_marks, classes, rotation = 0)
    plt.yticks(tick_marks, classes)

    thresh = cm.max() / 2
    for i, j in itertools.product(range(cm.shape[0]), range(cm.shape[1])):
        plt.text(j, i, cm[i, j], horizontalalignment = 'center',
                 color = 'white' if cm[i, j] > thresh else 'black')
    plt.tight_layout()
    plt.ylabel('True label')
    plt.xlabel('Predicted label')

from sklearn.linear_model import LogisticRegression
from sklearn.metrics import confusion_matrix

LR_model = LogisticRegression(class_weight = 'balanced', random_state = 42, penalty = 'l1')
LR_model.fit(gender_train, genderlabel)
y_pred = LR_model.predict(gender_train)
print(LR_model.score(gender_train, genderlabel))
cnf_matrix = confusion_matrix(genderlabel, y_pred)
print('Recall metric in the testing dataset:', cnf_matrix[1,1] / (cnf_matrix[1,0] + cnf_matrix[1,1]))
print('Accuracy metric in the testing dataset:', (cnf_matrix[1,1] + cnf_matrix[0,0])
      / (cnf_matrix[0,0] + cnf_matrix[0,1] + cnf_matrix[1,0] + cnf_matrix[1,1]))
class_names = [0, 1]
plt.figure(figsize = (8, 6))
plot_confusion_matrix(cnf_matrix, classes = class_names, title = 'Confusion matrix');
0.7988929889298892
Recall metric in the testing dataset: 0.8058852621167161
Accuracy metric in the testing dataset: 0.7988929889298892


