优达学城机器学习之--支持向量机(SVM)
前言
SVM是支持向量机的简称(Support Vector Machine)
文章目录如下:
- 简述
- 选择分隔线
- 核函数(kernel)及其参数c, gamma
- 过拟合 over-fitting
- SVM优缺点
简述
简单的来说,支持向量机所做的就是去寻找两类数据之间的分割线(seperatin line),或者称为超平面(hyperplane)。
假设我们有两类数据,支持向量机就是把这些点作为输入数据,输出一条线将这些数据分类。
选择分隔线
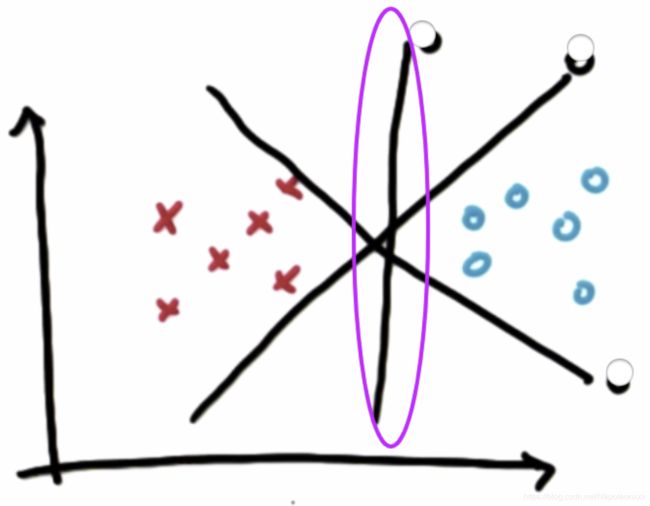
为什么选择中间这条线作为分隔线?
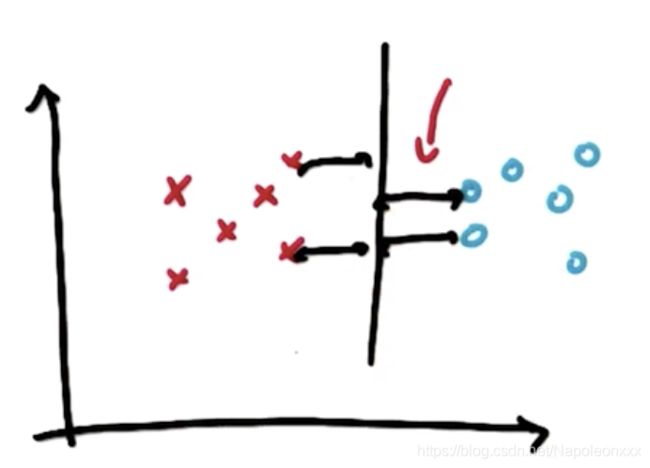
与其他线相比,它最大化了到最近点的距离,并且它对涉及到的两个分类均最大化了此类距离,这个距离通常被称为间隔 (Margin)。
这样分隔的好处是稳定,不容易出现分类误差。如果选择非常靠近现有数据的线,微弱的噪声也会使这些数据的分类结果发生错误,从而显得不那么稳定。所以支持向量机的核心是最大限度的提升结果的稳定性。
注意:支持向量机总是首先考虑是否正确的进行了分类,然后才是对间隔进行最大化。
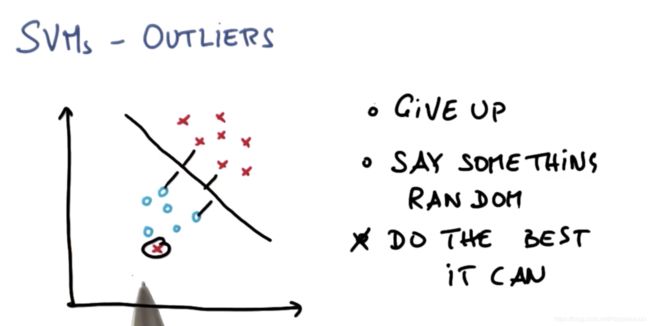
SVM对异常值的响应
可能有如下的数据集,显然将两个类分隔的决策面是不存在的。但是SVM还是会尽可能的得到一个最好的结果同时容忍个别异常数值。
SKlearn练习
还是以上篇文章中朴素贝叶斯用的驾驶数据集为例:
### ClassifySVM.py 定义一个svm分类器 (kernel = 'linear')
def classify(features_train, labels_train):

    from sklearn.svm import SVC

    clf = SVC(kernel="linear")
    ### fit the classifier on the training features and labels
    clf.fit(features_train, labels_train)
    ### return the fit classifier
    return clf
#!/usr/bin/python

""" Complete the code in ClassifySVM.py with the sklearn
    SVM classifier to classify the terrain data.

    The objective of this exercise is to recreate the decision
    boundary found in the lesson video, and make a plot that
    visually shows the decision boundary """

from prep_terrain_data import makeTerrainData
from class_vis import prettyPicture, output_image
from ClassifySVM import classify

import numpy as np
import pylab as pl

features_train, labels_train, features_test, labels_test = makeTerrainData()

### the training data (features_train, labels_train) have both "fast" and "slow" points mixed
### in together--separate them so we can give them different colors in the scatterplot,
### and visually identify them
grade_fast = [features_train[ii][0] for ii in range(0, len(features_train)) if labels_train[ii] == 0]
bumpy_fast = [features_train[ii][1] for ii in range(0, len(features_train)) if labels_train[ii] == 0]
grade_slow = [features_train[ii][0] for ii in range(0, len(features_train)) if labels_train[ii] == 1]
bumpy_slow = [features_train[ii][1] for ii in range(0, len(features_train)) if labels_train[ii] == 1]

# You will need to complete this function imported from the ClassifyNB script.
# Be sure to change to that code tab to complete this quiz.
clf = classify(features_train, labels_train)

### draw the decision boundary with the text points overlaid
prettyPicture(clf, features_test, labels_test)
output_image("test.png", "png", open("test.png", "rb").read())
运行结果如下:
非线性SVM – kernel trick (核技巧)
SVM给出的是基于线性分隔的分类器,那么它是如何可以绘制出复杂的决策边界?这就是本节的讨论内容。
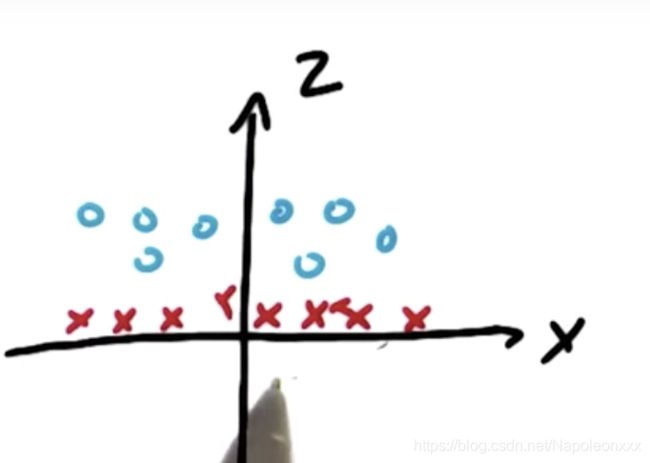
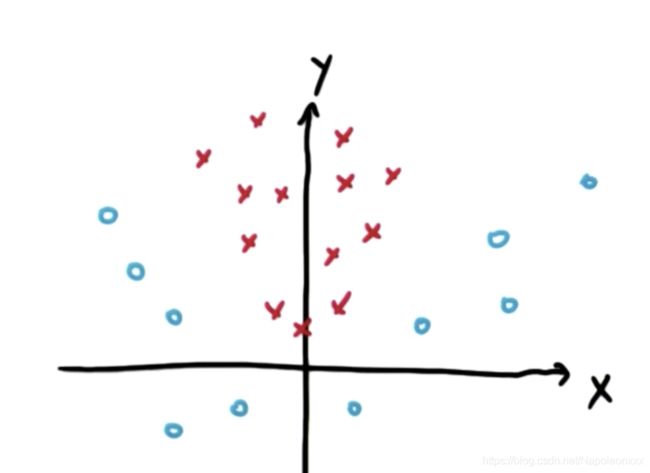
根据上图,我们可以直观的判断出这两个类之间不存在明显的线性超平面,即很难在两个类之间画一条线。但事实上支持向量机SVM可以对这样的数据进行分类。
以上图为例,就是构造新特征。如果向量机学习了x平方加y平方的类,我们把这个新特征称为z。即z = x2 + y2
再看一个栗子:
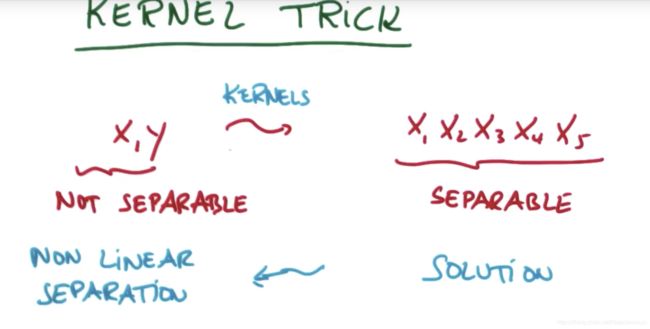
实际上,我们无需手动写一堆新的特征,svm提供了一个叫做核技巧(kernel trick)的方法。
核函数,接收低维度的输入空间或特征空间,并将其映射到高维度空间,所以过去不可线性分隔的内容变为可分隔。
应用核函数技巧将输入空间从x, y变换到更大的输入空间后,再使用输入向量机对数据点进行分类,得到解以后返回原始空间,这样就能得到一个非线性分隔。
核 kernel 与伽玛
sklearn svc中的核函数包括linear(线性),poly(多项式),rbf(径向基函数),sigmoid(s函数)
除了核,SVM还有两个重要参数是C和y (gamma)
gamma参数实际上对 SVM 的“线性”核函数没有影响,使用核rbf,下图是不用gamma的效果。
 clf = SVC(kernel="rbf", gamma=1)

 ##  clf = SVC(kernel="rbf", gamma=1000)
C的作用是在光滑的决策边界以及尽可能正确分类所有训练点两者之间进行平衡。下图是不同C的效果(用核rbf效果更明显)。
clf = SVC(kernel="rbf", C=1)

## clf = SVC(kernel="rbf", C=3000)
过拟合 over fitting
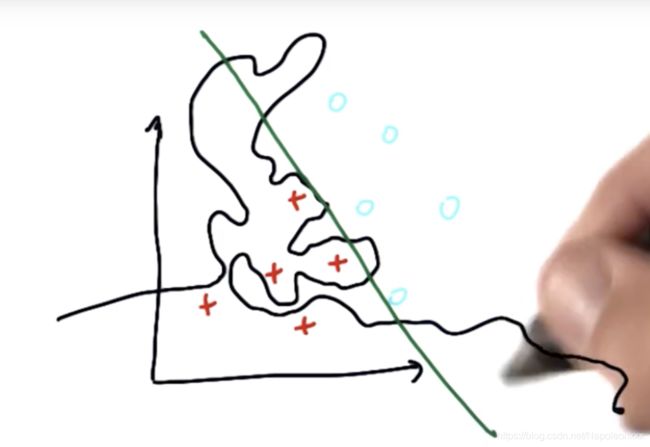
当我们看到非常复杂的决策边界时,很有可能是过拟合的。这是机器学习过程中很常见也是需要特别关注的一个现象。
如下图所示,红色数据被正确分类,但是决策面的其他许多位置看上去非常奇怪,如果仅仅是照搬原始数据进行分类,机器学习算法就会产生类似的复杂结果。而不是产生了像直线这样简单的结果,这就意味着出现了过拟合。
控制过拟合的方法就是通过调整算法的参数。例如在SVM中,c,gamma,核函数。机器学习的艺术性就在于调节这些参数
SVM的优缺点
对于具有明显分隔边界的复杂数据,支持向量机的表现非常出色。对于海量数据,表现则不太好,因为在这种规模的数据集中,训练时间与数据量的三次方成正比。对于数据集噪声过大的情况,支持向量机的效果也不好。
如果类之间的重叠较多且需要将不同类分隔开,此时朴素贝叶斯分类器会更有效。
