qplot\ggplot2 绘制箱型图、散点图
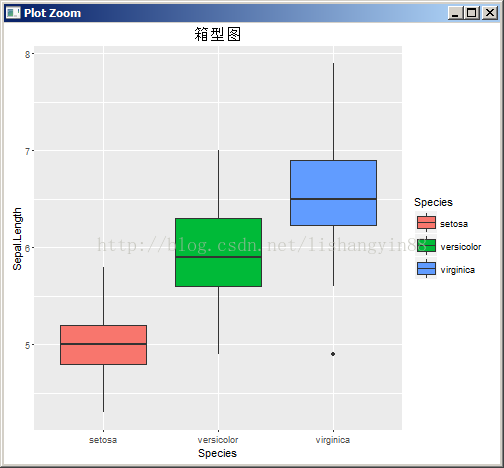
1.箱型图
我们利用qplot 来画图,使用iris中的数据。
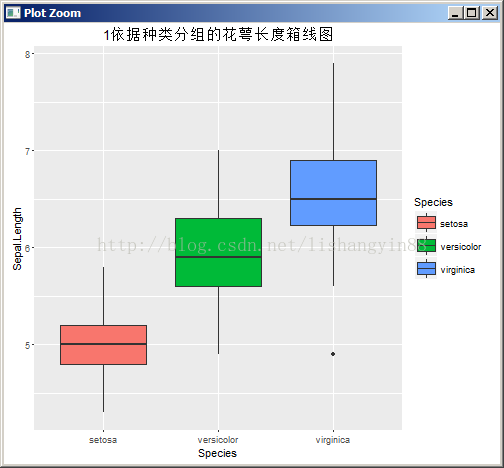
qplot(Species,Sepal.Length,data=iris,
geom=c("boxplot"),fill=Species,main="1依据种类分组的花萼长度箱线图")
#geom 表示画的是什么图形。fill表示轮廓以内的填充颜色(不包括轮廓的颜色),控制轮廓的颜色使用color函数。
2.小提琴图
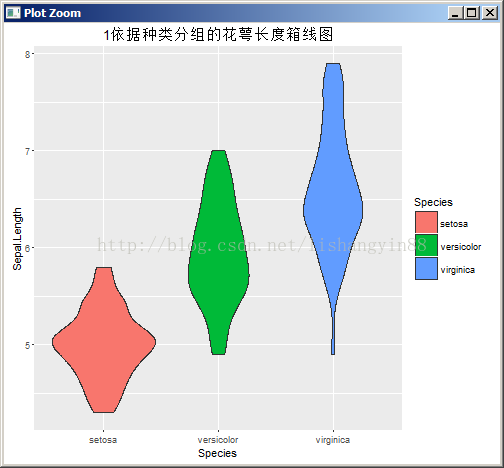
qplot(Species,Sepal.Length,data=iris,
geom=c("violin"),
fill=Species,main="1依据种类分组的花萼长度箱线图")
#如果不定义fill 函数的话,默认是白色的填充。
3.散点图。
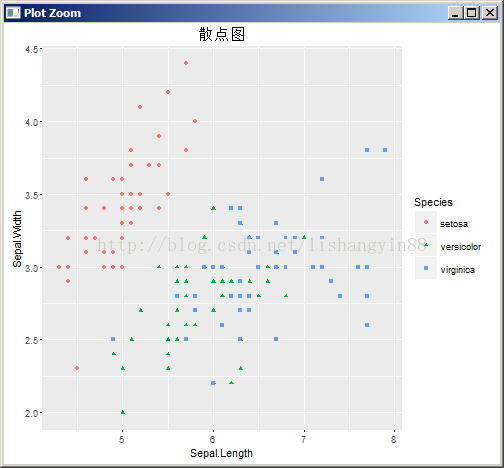
qplot(Sepal.Length,Sepal.Width,data=iris,geom=c("point"),color=Species,shape=Species,main="散点图"
#定义了颜色和形状。
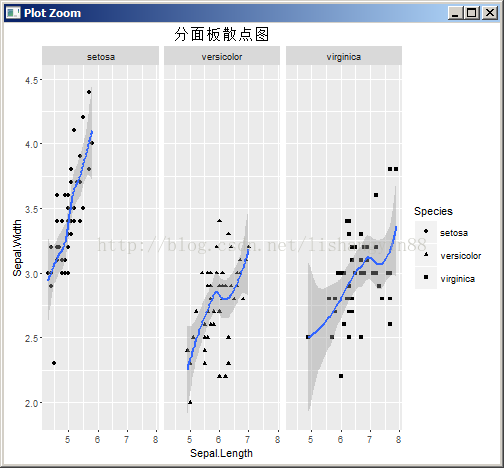
若是分成面板单独来画呢?面板用那个 ?对,facets!
> qplot(Sepal.Length,Sepal.Width,data=iris,geom=c("point"),
+ facets=Species,col=Species,main="分面板散点图")
Error in qplot(Sepal.Length, Sepal.Width, data = iris, geom = c("point"), :
object 'Species' not found
错在哪了? 貌似没错,就是按照Species进行分的啊。注意这里有个特殊的地方就是
写面板的时候不要忘掉“~”!!!上式没有写"~",导致无法找到Species!!
正确的式子应该是:
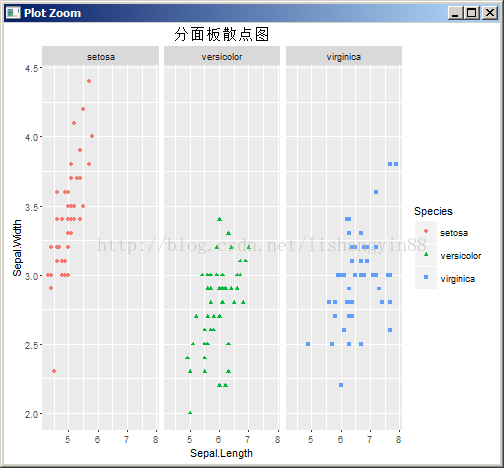
qplot(Sepal.Length,Sepal.Width,data=iris,geom=c("point"),
facets=~Species,color=Species,shape=Species,main="分面板散点图")
如果再添加上拟合曲线,则geom里面多加上“smooth”
qplot(Sepal.Length,Sepal.Width,data=iris,geom=c("point"),
facets=~Species,color=Species,shape=Species,main="分面板散点图")
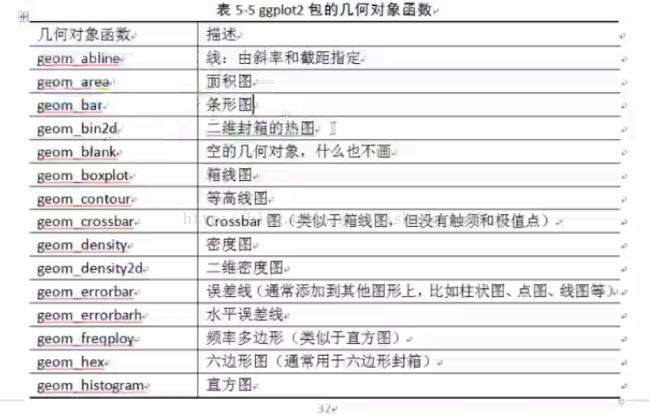
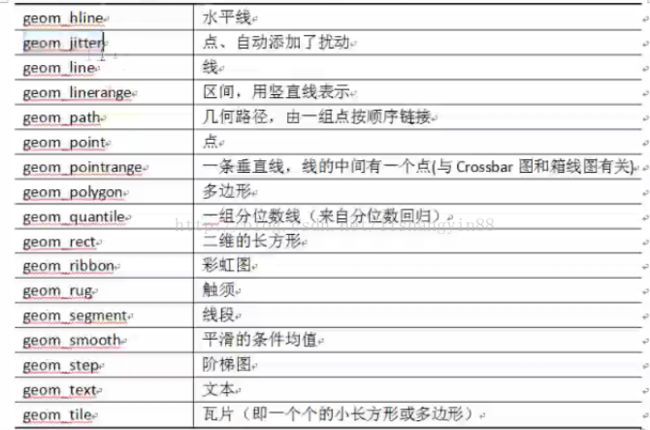
4.ggplot常用的函数。
4.用ggplot 绘制图形。
ggplot(iris,aes(x=Species,y=Sepal.Length,fill=Species))+geom_boxplot()+labs(title="箱型图")
#aes主要设置x轴和y 轴以及填充色。geom_boxplot()可以设置上面标哥列举的内容。
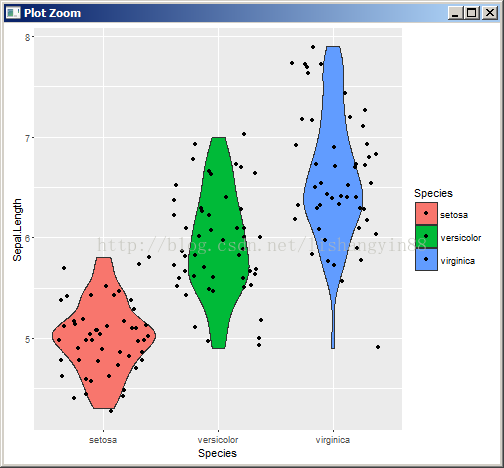
同理假若改成小提琴图:
ggplot(iris,aes(x=Species,y=Sepal.Length,fill=Species))+geom_violin()+labs(titile="小提琴图")+geom_jitter()
5.分面板图形。
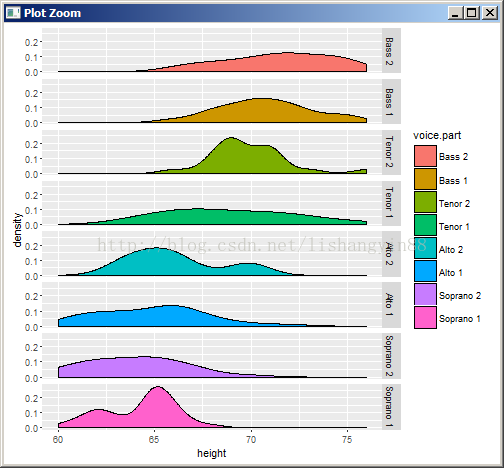
ggplot(singer,aes(x=height,fill=voice.part))+geom_density()+facet_grid(voice.part~.)
#这里要注意face_gird(voice.part~.),第一点是“~”不要忘掉,另外这里多了个“.”,特别引起注意。
6.改变排列行和列。
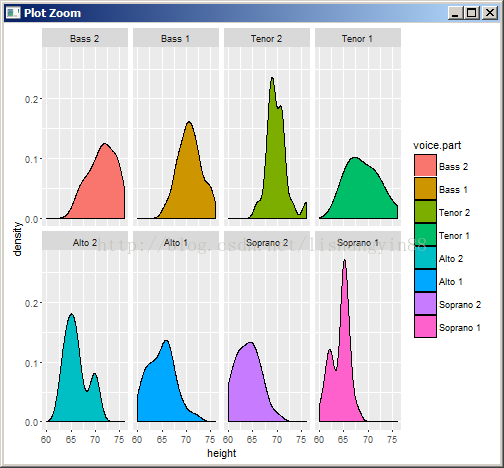
ggplot(singer,aes(x=height,fill=voice.part))+geom_density()+facet_wrap(~voice.part,ncol=4)
#注意此时,“~”在voice.part前面,后面是列的数量。
如果去掉图例则在后面加上,+theme(legend.position="none").
7.ggplot 画散点图。
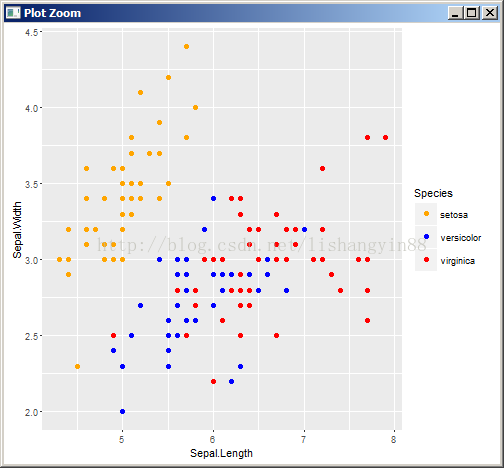
ggplot(iris,aes(x=Sepal.Length,y=Sepal.Width,color=Species))+geom_point()
#此处的color不要忘掉,要不然都是同一种颜色。
那如何对图形更改颜色呢?用scale_color_manual来更改(前提是已经被设置了颜色,然后要更改设置的颜色)。
ggplot(iris,aes(x=Sepal.Length,y=Sepal.Width,color=Species))+geom_point(size=2)+scale_color_manual(values=c("orange","blue","red"))
#更改了点的大小,颜色的取值(不要忘记写values=)
