基于 FGI 指数的比特币购买策略分析
目录
前言
FGI 指数
比特币价格爬取
策略
后记
前言
最近开始关注比特币,在网络上看到了一种 基于 FGI 指数的比特币购买策略。看上去比较有道理,但没有数据支撑是无法让我信服的,于是利用历史数据模拟了使用该种策略从 2018年2月2日到2020年7月5日的交易过程。
FGI 指数
类似于美股的恐慌指数,FGI 指数是衡量加密货币市场的恐慌指数。alternative.me 提供了每天的 FGI 指数,据该网站介绍,FGI 指数是一个 0 到 100 之间的整数值,0 表示极度恐慌,100 表示嫉妒贪婪。
该网站提供了相关的 api, 可以方便的获取需要的信息:
https://api.alternative.me/fng/?limit=0&format=json&date_format=cnlimit = 0 表示获取所有时间段的信息,format = json 表示数据以 json 格式呈现,data_format = cn 表示时间格式以中文格式呈现。更多的参数信息见 原网站。
将数据复制并保存为 fgi.json,使用 python 进行一些处理。
import json
import pandas as pd
import numpy as np

filename = 'fgi.json'

with open(filename) as f:
    fgi_data = json.load(f)['data'] # 打开 json 文件

fgi_df = pd.DataFrame(fgi_data)     # 转化为 dataframe 格式
fgi_df['value'] = fgi_df['value'].astype(int)    # 将 value 列的属性变为整型

# 去掉用不到的列
fgi_df.drop(columns = ['value_classification', 'time_until_update'], inplace = True)

# 将 dataframe 逆序,也就是说变为从 2018 年 2 月 2 日到 2020 年 7 月 5 日
fgi_df = fgi_df.iloc[::-1]

# 2018 年 2 月 1 日的数据多余了,去掉
fgi_df = fgi_df.drop(882)

# 逆序后,需要将行号变正常
fgi_df.index = pd.Series([i for i in range(882)])
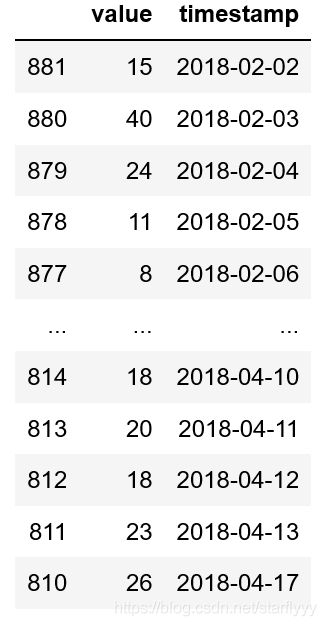
实际处理过程中发现竟然有三天的 FGI 指数的数据缺失了。
fgi_df[0:72]将缺失的数据用 np.nan 补全:
df_blank = pd.DataFrame({'value': [np.nan, np.nan, np.nan], 'timestamp': ['2018-04-14', '2018-04-15', '2018-04-16']})

fgi_df_tmp1 = fgi_df[0:71]

fgi_df_tmp2 = fgi_df[71:]

fgi_df = fgi_df_tmp1.append(df_blank, ignore_index = True).append(fgi_df_tmp2, ignore_index = True)
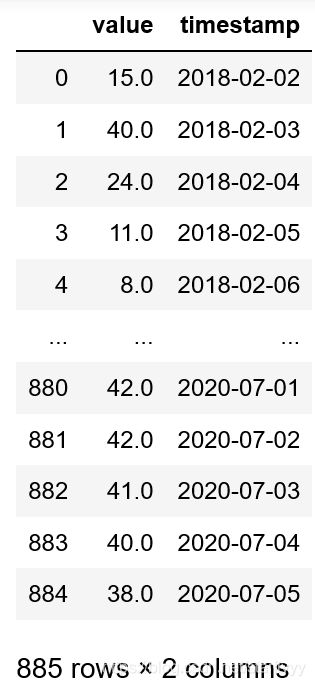
现在的 fgi 数据是这个样子的:
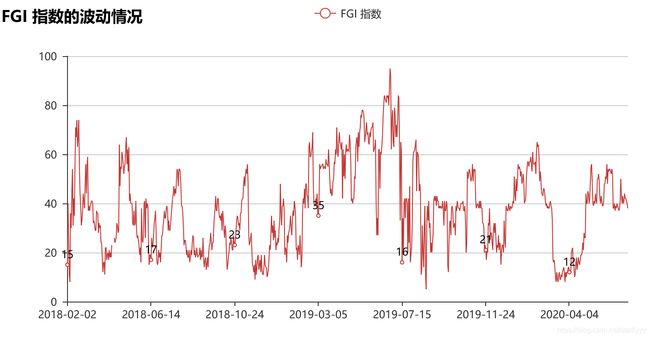
画个图看一下变化情况:
from pyecharts import Line

line = Line('FGI 指数的波动情况')
line.add('FGI 指数', fgi_df['timestamp'], fgi_df['value'], is_label_show = True)
line.render()
FGI 指数的获取暂时告一段落,下面我们进行比特币价格的爬取。
比特币价格爬取
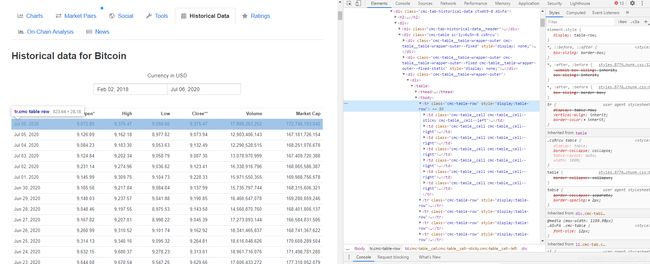
比特币的数据来自 coinmarketcap ,打开网页,选择 Bitcoin, 选择 Historical Data, 选择时间区间为 Feb 02, 2018 到 Jul 06,2020。结果如下:
使用 Crome 浏览器的检查功能进行数据定位:
我们需要的数据就是右边
import requests
from lxml import etree
import pandas as pd
import numpy as np

res = requests.get(r'https://coinmarketcap.com/currencies/bitcoin/historical-data/?start=20180202&end=20200706')
selector = etree.HTML(res.text)
url_infos = selector.xpath('//td') # 使用 xpath 语法获取所有标签为 td 的节点

del url_infos[6200 : 6214]  # 该区间的数据是无效的,去掉

# 将数据进行一行一行的存储
data = []
line = []
i = 0
for url_info in url_infos:
    tmp = url_info.xpath('div/text()')
    if (i < 7):
        try:
            line.append(tmp[0].replace(',','')) # 去掉数字中的逗号
        except:
            line.append(np.nan)
        i = i + 1
    else:
        data.append(line)
        line = []
        try:
            line.append(tmp[0].replace(',',''))
        except:
            line.append(np.nan)
        i = 1

# 将数据转化成 DataFrame 格式的
arr = np.array(data)
df = pd.DataFrame(arr)
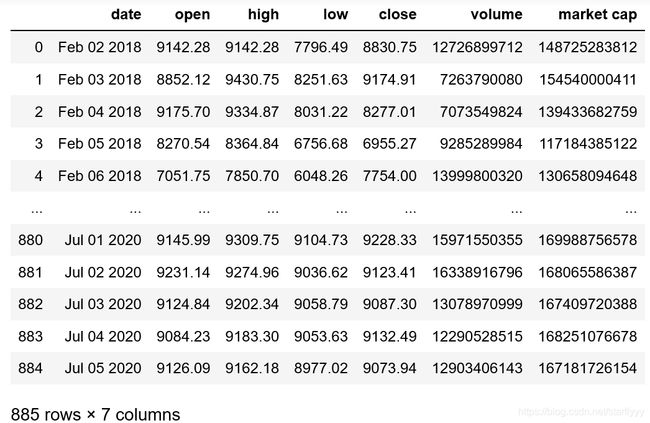
df.columns = ['date', 'open', 'high', 'low', 'close', 'volume', 'market cap']

df['close'] = df['close'].astype(float)
df = df.iloc[::-1] # 将 df 逆序
df.index = pd.Series([i for i in range(885)])
整理好的数据是这个样子的:
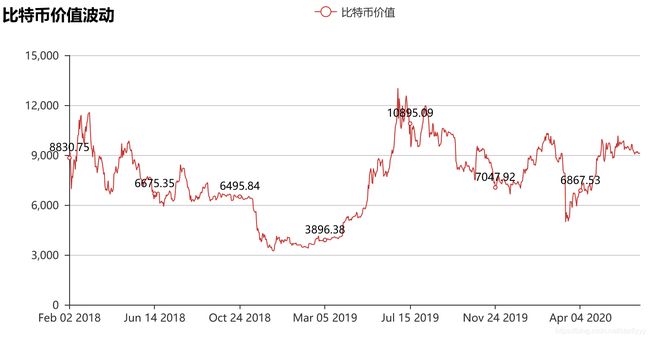
画个图看一下比特币的走势:
下面讲一下基于 FGI 指数的基本策略。
策略
- 在 fgi 指数处于 0-25 之间时买入一个单位(5000 USD)
- 在 fgi 指数处于 25-45 之间时暂停交易
- 在 fgi 指数处于 45-75 之间时卖出一个单位(5000 USD)
- 在 fgi 指数处于 75-100 之间时卖出两个单位(10000 USD)
用通俗的话来讲,就是巴菲特老爷子说的,别人恐惧(fgi < 25) 我贪婪(买入), 别人贪婪(fgi > 45) 我恐惧(卖出)。
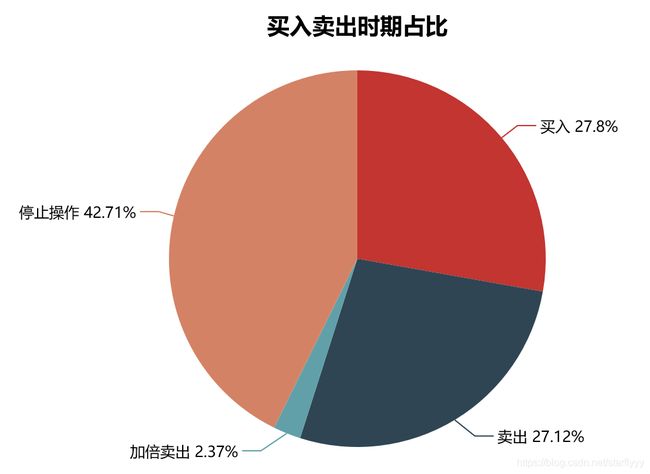
首先先看一下基于这个策略,我们的买入卖出的分布:
从饼图中,可以看出,我们买入和卖出的天数相差不大。下面进行实际策略的模拟。
说明:(df 是我们将前两节得到的两个 DataFrame 进行合并后的结果)
- 当前投入 now_invest
- 当前比特币的持有数目 now_bitcoins
- 当前盈利 now_earn = now_value - now_invest
- 手中 bitcoin 的价值,按当天收盘时的价格来计算,now_value = now_bitcoins * df['close']
- 买入和卖出的价格按当前最高和最低价格的平均值来计算 (df['high'] + df['low']) / 2
buy = 5000
sell = 5000
sell_double = 10000
now_invest = 0
now_value = 0
now_earn = 0
now_bitcoins = 0

earn = []
invest = []
date = []

for i in range(885):
    now_item = df[i:(i+1)]
    now_date = now_item['date'][i]
    fgi_index = now_item['fgi_index'][i]
    avr = (now_item['high'][i] + now_item['low'][i]) / 2
    close = now_item['close'][i]

    if (fgi_index <= 25.0):
        now_invest += buy
        now_bitcoins += buy / avr
        now_value = now_bitcoins * close
        now_earn = now_value - now_invest

        earn.append(now_earn)
        invest.append(now_invest)
        date.append(now_date)

    elif (fgi_index > 45.0 and fgi_index < 75.0):
        if (now_bitcoins * avr >= sell):
            now_invest -= sell
            now_bitcoins -= sell / avr
        else:
            now_invest -= now_bitcoins * avr
            now_bitcoins = 0
        now_value = now_bitcoins * close
        now_earn = now_value - now_invest

        earn.append(now_earn)
        invest.append(now_invest)
        date.append(now_date)

    elif (fgi_index > 75.0):
        if (now_bitcoins * avr >= sell_double):
            now_invest -= sell_double
            now_bitcoins -= sell_double / avr
        else:
            now_invest -= now_bitcoins * avr
            now_bitcoins = 0
        now_value = now_bitcoins * close
        now_earn = now_value - now_invest

        earn.append(now_earn)
        invest.append(now_invest)
        date.append(now_date)
    else:
        continue
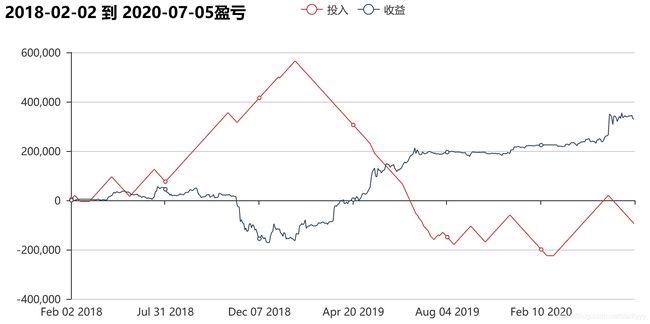
画出盈亏曲线:
结果非常 amazing 啊,我们从大约 2019 年 6 月开始,投入开始变为负,也就是说我们开始只用盈利进行投资了。
但是另外一个值得注意的是,从 2018 年 10 月开始到 2019 年 4 月,我们需要经历半年的亏损期,而在这之间还需要不断的投入资金,最高时已经接近 60 w USD。在这之间我们能否坚持自己的信念,能否有稳定的现金流是一个很大的问题。
所以说,没有万能的策略,资本的市场本就是反人性的。能拥有自己的投资方式,并几年如一日的坚持下去,才能获得最后的成功。也算是理解了很多老股民说的用闲钱投资,别加杠杆的原因了。
后记
本人非专业金融系学生,有很多金融知识的错误在所难免,欢迎交流!
