android核心技术之性能分析工具Systrace
Systrace
While developing your application, you should check that user interactions are buttery smooth, running at a consistent 60 frames per second. If something goes wrong, and a frame gets dropped, the first step in fixing the problem is understanding what the system is doing.
一般来说,我们的机器以60帧/秒显示时(也就是16.6 millisecond),用户会感觉机器会流畅。如果出现显示时出现丢帧的情况,我们要知道系统在做什么。
Systrace collects system and application process execution data and generates detailed, interactive reports from devices running Android 4.1 and higher.
Systrace 是用来收集系统和应用的数据信息和一些中间生成数据的细节,在Android 4.1系统和4.1之后的系统。
The Systrace tool is particularly useful in diagnosing display problems where an application is slow to draw or stutters while displaying motion or animation.
Systrace在一些分析显示的问题上特别有用,如应用画图慢,显示动作或动画时变形等。
What it’s good for:
• Evaluating container performance.(评估性能)
• Finding performance bottlenecks in the execution of your code.(查找性能瓶颈)
启动Systrace
先把手机的Trace功能打开:Settings > Developer options > Monitoring > Enable traces.
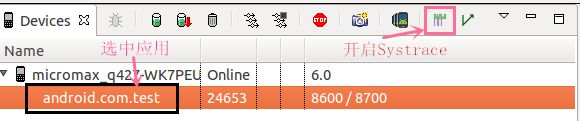
如果是Eclipse,直击点击DDMS的Systrace图标,如果是Android Studio,则Tools–android–Android Device Monitor,再点击DDMS的Systrace图标,如下图(也可以直接双击\Sdk\tools\monitor.bat文件来启动这个界面):
在执行收集信息前,先填写一些配置信息:
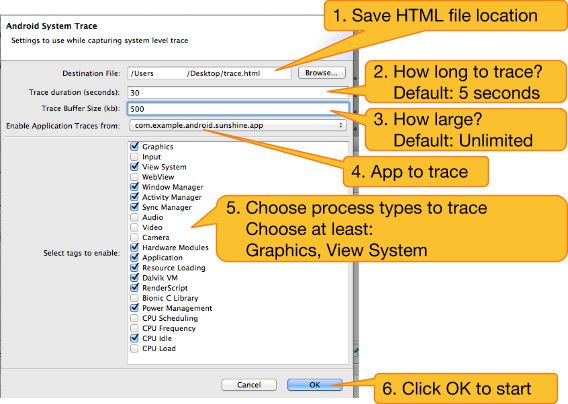
生成trace.html 文件后,直接在浏览器中打开就可以。
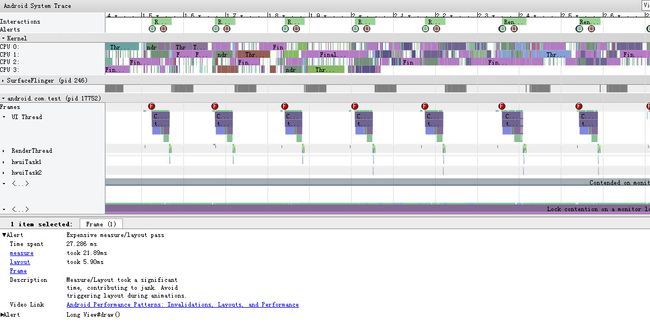
我们可以看到此界面的Frame的圆圈会显示三种颜色,绿,黄,红。一般红色就是有问题的,要优化的地方。
我们操作此界面的方法如下:
| Key | Description |
|---|---|
| w | 放大 |
| s | 缩小 |
| a | 左移 |
| d | 右移 |
| g | 切换是否显示60hz的网格线 |
| Right Arrow | Select the next event on the currently selected timeline. |
| Left Arrow | Select the previous event on the currently selected timeline. |
| m | 可以显示选中方法的时间 |
| y | 放大当前选定区域 |
| v | 高亮VSync |
| 0 | 恢复trace到初始态,这里是数字0而非字母o |
| / | 搜索关键字 |
| enter | 显示搜索结果,可通过← →定位搜索结果 |
模式切换
Select mode: 双击已选定区能将所有相同的块高亮选中;(对应数字1)
Pan mode: 拖动平移视图(对应数字2)
Zoom mode:通过上/下拖动鼠标来实现放大/缩小功能;(对应数字3)
Timing mode:拖动来创建或移除时间窗口线。(对应数字4)
Systrace does automatic analysis of the events in the trace, and highlights many performance problems as alerts, suggesting what to do next.
Systrace会自动分析信息,将性能问题直接以alerts的方式高亮显示,我们只要修改这些alerts就可以。
Alert如下图:
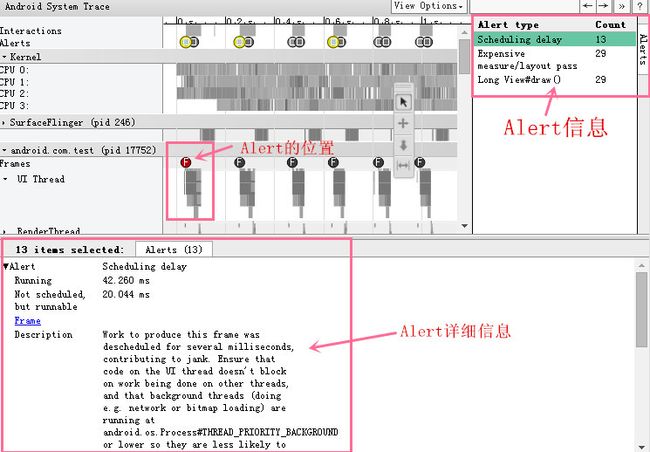
我们可以看到Alert的详细信息,描述和建议。这个Alert是可以定位到有问题的方法。如果我们想要知道方法的更详细信息,我们可以结合Traceview来解决问题。
自定义systrace
java framework层
import android.os.Trace;
Trace.traceBegin(long traceTag, String methodName)
Trace.traceEnd(long traceTag)
在代码中必须成对出现,一般将traceEnd放入到finally语句块,另外,必须在同一个线程。
app层
import android.os.Trace;
Trace.beginSection(String sectionName);
Trace.endSection();
这里默认的traceTag为TRACE_TAG_APP,systrace命令通过指定app参数即
native framework层
#include
ATRACE_CALL();
命令用法
命令行
Sdk\platform-tools\systrace\systrace.py文件路径
python systrace.py [options] [category1] [category2] ... [categoryN]
其中options可取值:
| options | 解释 |
|---|---|
| -o | 输出的目标文件 |
| -t N, –time=N | 执行时间,默认5s |
| -b N, –buf-size=N | buffer大小(单位kB),用于限制trace总大小,默认无上限 |
| -k ,–ktrace= | 追踪kernel函数,用逗号分隔 |
| -a |
追踪应用包名,用逗号分隔 |
| –from-file= |
从文件中创建互动的systrace |
| -e |
指定设备 |
| -l, –list-categories | 列举可用的tags |
category可取值:
| category | 解释 |
|---|---|
| gfx | Graphics |
| input | Input |
| view | View System |
| webview | WebView |
| wm | Window Manager |
| am | Activity Manager |
| sm | Sync Manager |
| audio | Audio |
| video | Video |
| camera | Camera |
| hal | Hardware Modules |
| app | Application |
| res | Resource Loading |
| dalvik | Dalvik VM |
| rs | RenderScript |
| bionic | Bionic C Library |
| power | Power Management |
| sched | CPU Scheduling |
| irq | IRQ Events |
| freq | CPU Frequency |
| idle | CPU Idle |
| disk | Disk I/O |
| mmc | eMMC commands |
| load | CPU Load |
| sync | Synchronization |
| workq | Kernel Workqueues |
| memreclaim | Kernel Memory Reclaim |
| regulators | Voltage and Current Regulators |
在systrace.py所在目录下执行指令:
python systrace.py -b 32768 -t 5 -o mytrace.html wm gfx input view sched freq
./systrace.py -b 32768 -t 5 -o mytrace.html wm gfx input view sched freq //等价
又例如,输出全部的trace信息
python systrace.py -b 32768 -t 5 -o mytrace.html gfx input view webview wm am sm audio video camera hal app res dalvik rs bionic power sched irq freq idle disk mmc load sync workq memreclaim regulators
Demo定位
我们搞一个故意延时18s的方法,看看此工具可以定位到不:
public class MainActivity extends AppCompatActivity {

    public static final String TAG = "test";
    private Button button;

    private Handler handler = new Handler(){
        @Override
        public void handleMessage(Message msg) {
            super.handleMessage(msg);
                switch (msg.what){
                    case 1:
                        try {
                            //延时18秒
                            Thread.sleep(18000);
                        } catch (InterruptedException e) {
                            e.printStackTrace();
                        }
                        Toast.makeText(MainActivity.this,"test",Toast.LENGTH_LONG).show();
                        button.setText("Click_dow");
                        Trace.endSection();
                        break;
                }

        }
    };

    @Override
    protected void onCreate(Bundle savedInstanceState) {
        super.onCreate(savedInstanceState);
        setContentView(R.layout.activity_main);
        Trace.beginSection("hxm_trace");
        init();
    }

    private void init() {
        button = (Button) findViewById(R.id.button);
        button.setOnClickListener(new View.OnClickListener() {
            @Override
            public void onClick(View v) {
                handler.sendEmptyMessage(1);
            }
        });
    }
}
启动应用,点击button,将收集到的ststrace文件打开:
我们看到我们的应用:com.readygo.test
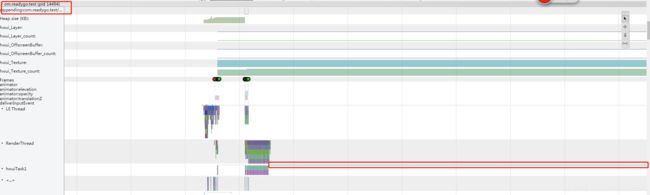
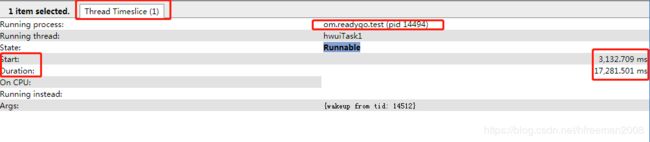
我们可以看到其线程信息:
在3秒时启动,操作了18秒,是不是一下就定位到了.
参考资料
1.Android性能优化之Systrace分析UI性能
http://blog.csdn.net/neacy_zz/article/details/50404863
2.Android性能优化之Systrace分析app启动分析
http://chendongqi.me/2017/02/18/systrace_appLauncher/
3.Android性能优化之Systrace分析drag响应时间
http://chendongqi.me/2017/02/18/systrace_drag/
4.Android性能优化之Systrace分析基础
http://chendongqi.me/2017/02/18/systrace_base/
5.手把手教你使用Systrace(一)
https://zhuanlan.zhihu.com/p/27331842
6.手把手教你使用Systrace(二)——锁优化
https://zhuanlan.zhihu.com/p/27535205?group_id=861682866420072448
7.性能工具Systrace
http://gityuan.com/2016/01/17/systrace/
8.Android性能分析工具systrace使用
https://www.cnblogs.com/1996swg/archive/2018/11/23/10007602.html