第二章 numpy库中的全美婴儿案例
#全美婴儿案例
数据集可以做很多事儿:
1、计算指定名字(可以是自己的,也可以是别人的)的年度比例
2、计算某个名字的相对排名
3、计算各年度最流行的名字,以及增长或减少最快的名字
4、分析名字趋势:元音、辅音、长度、总体多样性、拼写变化、首尾字母等
5、分析外源性趋势:圣经中的名字、名人、人口结构变化等
#为什么用read_table增加标题就会多增加两列?
names1880=pd.read_csv('E:/yob1880.txt',names=['name','sex','births'])
names1880[:10]
#用births列的sex组小计表示该年度的births总计
names1880.groupby('sex').births.sum()
#将各年度的数据整合在一个数据框中,用pandas.concat函数即可
#2010是目前最后一个有效的统计年度
years=range(1880,2011)
pieces=[]
columns=['name','sex','births']
for year in years:
path='E:/names/yob%d.txt' % year
frame=pd.read_csv(path,names=columns)
frame['year']=year
pieces.append(frame)
#将所有数据整合到单个DataFrame中
names_new=pd.concat(pieces,ignore_index=True)
#利用groupby和pivot_table在year和sex级进行聚合
total_births=names_new.pivot_table('births',index='year',columns='sex',aggfunc=sum)
total_births
#插入prob列,存放指定的婴儿数相对于总出生数的比例
def add_prop(group):
births=group.births.astype(float)
group['prop']=births/births.sum()
return group
names_new=names_new.groupby(['year','sex']).apply(add_prop)
names_new[:10]
#检查:验证所有的prob总和是否为1
import numpy as np
np.allclose(names_new.groupby(['year','sex']).prop.sum(),1)
#取数据子集,每对sex/year组合的前1000个名字
def get_top1000(group):
return group.sort_values(by='births',ascending=False)[:1000]
grouped=names_new.groupby(['year','sex'])
top1000=grouped.apply(get_top1000)
#将前1000个名字分为男女两个部分
boys=top1000[top1000.sex=='M']
girls=top1000[top1000.sex=='F']
#生成一个按year和name统计的总出生数据透视表
total_births=top1000.pivot_table('births',index='year',columns='name',aggfunc=sum)
subset=total_births[['John','Harry','Mary','Marilyn']]
%matplotlib inline
subset.plot(subplots=True,figsize=(12,10),grid=False,title="Number of births per year")
#评估命名多样性的增长,计算最流行的1000个名字所占的比例,按year和sex聚合并画图
table=top1000.pivot_table('prop',index='year',columns='sex',aggfunc=sum)
table.plot(title="Sum of table1000.prop by year and sex",yticks=np.linspace(0,1.2,13),
xticks=range(1880,2020,10))
#计算总出生人数前50%的不同名字的数量,只考虑2010年男孩的名字
df=boys[boys.year==2010]
#对prop降序,先计算prob的累计和cumsum,通过searchsorted找出0.5应该被插在哪里
prop_cumsum=df.sort_values(by='prop',ascending=False).prop.cumsum()
prop_cumsum[:10]
prop_cumsum.searchsorted(0.5)
#索引从0开始,应该+1,共117个。拿1900年比较,这个值要小的多,仅为25
df=boys[boys.year==1900]
prop_cumsum=df.sort_values(by='prop',ascending=False).prop.cumsum()
prop_cumsum.searchsorted(0.5)+1
def get_quantile_count(group,q=0.5):
group=group.sort_values(by='prop',ascending=False)
return group.prop.cumsum().searchsorted(q)[0]+1
#注意searchsorted(q)[0]需要先取[0]操作,否则画图会报错
diversity=top1000.groupby(['year','sex']).apply(get_quantile_count)
diversity=diversity.unstack('sex')
#依靠sex入栈操作,将Series转为DataFrame
diversity.head#diversity这个dataframe拥有两个时间序列,每个性别各一个,按年度
Out[112]:
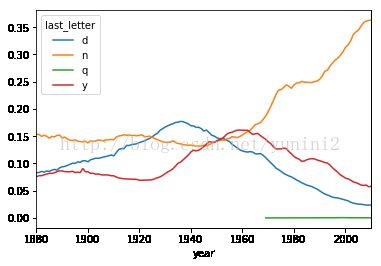
last_letter d n q y
year
1880 0.083055 0.153213 NaN 0.075760
1881 0.083247 0.153214 NaN 0.077451
1882 0.085340 0.149560 NaN 0.077537
1883 0.084066 0.151646 NaN 0.079144
1884 0.086120 0.149915 NaN 0.080405
dny_ts.plot() #编程女孩名字的男孩名字 all_names=top1000.name.unique() mask=np.array(['lesl' in x.lower() for x in all_names]) lesley_like=all_names[mask] lesley_like
Out[163]: array(['Leslie', 'Lesley', 'Leslee', 'Lesli', 'Lesly'], dtype=object) #然后利用这个结果过滤其他名字,并按名字分组计算出生数以查看相对频率 filtered=top1000[top1000.name.isin(lesley_like)]
filtered.groupby('name').births.sum() name Leslee 1082 Lesley 35022 Lesli 929 Leslie 370429 Lesly 10067 Name: births, dtype: int64 #按性别和年度进行聚合,并按年度进行规范化处理 table=filtered.pivot_table('births',index='year',columns='sex',aggfunc='sum') table=table.div(table.sum(1),axis=0) table.head()
Out[170]:
sex F M
year
2006 1.0 NaN
2007 1.0 NaN
2008 1.0 NaN
2009 1.0 NaN
2010 1.0 NaN
table.plot(style={'M':'k-','F':'k--'})