28Python库分析科比生涯数据
唐宇迪《python数据分析与机器学习实战》学习笔记
28Python库分析科比生涯数据 基本的一个操作流程,没有多深入
一、数据预处理
先来看一下数据,每个样本有25个属性,包括:
A:action_type(用什么方式投的篮)
B:combined_shot_type(结合什么方式投篮)
C:game_event_id(游戏事件ID)
D:game_id(游戏ID)
E:la(投篮的经度)
F:loc_x (投篮的x坐标)
G:loc_y(投篮的y坐标)
H:lon(投篮的纬度)
I:minutes_remaining(离比赛结束还有多少分钟)
J:period(第几场)
K:playoffs(是不是季后赛)
L:season(赛季)
M:seconds_remaining(离比赛结束还有多少秒)
N:shot_distance(投篮离篮筐的的距离)
O:shot_made_flag (是不是进球了)这里就是label
P:shot_type(2分球还是3分球区域)
Q:shot_zone_area(投篮区域表示方式一)
R:shot_zone_basic(投篮区域的表示方式二)
S:shot_zone_range(投篮区域的表示方式三)
T:team_id(队伍ID)
U:team_name(队伍名字)
V:game_date(比赛时间)
W:matchup(比赛双方队伍)
X:opponent(自己所在队伍名字)
Y:shot_id(镜头ID)


label为O列:0没进,1进了,还有些缺失值这里需要去除。
导入模块
import numpy as np
import pandas as pd
import matplotlib.pyplot as plt
%matplotlib inline
from sklearn.ensemble import RandomForestClassifier
from sklearn.model_selection import KFold
导入数据
filename= "data.csv"
raw = pd.read_csv(filename)
print (raw.shape)
(30697, 25)
缺失值处理
kobe =  raw[pd.notnull(raw['shot_made_flag'])]#notnull如果不是空值就保留
print (kobe.shape)
(25697, 25)
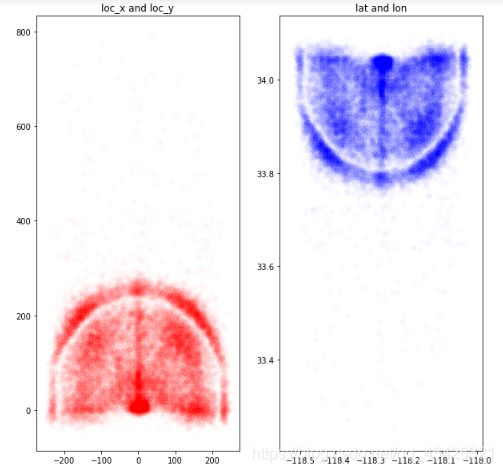
特征样本点分布观察
alpha = 0.02
plt.figure(figsize=(10,10))

# loc_x 和 loc_y,投篮位置
plt.subplot(121)
plt.scatter(kobe.loc_x, kobe.loc_y, color='R', alpha=alpha)
plt.title('loc_x and loc_y')

# lat 和 lon,经度纬度
plt.subplot(122)
plt.scatter(kobe.lon, kobe.lat, color='B', alpha=alpha)
plt.title('lat and lon')

发现两个特征表达的投篮位置都一样,所以接下来可以任意一个。
这里保留前者xy,为了方便表达将其转换为极坐标
raw['dist'] = np.sqrt(raw['loc_x']**2 + raw['loc_y']**2)#距离计算

loc_x_zero = raw['loc_x'] == 0 #角度计算
#print (loc_x_zero)
raw['angle'] = np.array([0]*len(raw))
raw['angle'][~loc_x_zero] = np.arctan(raw['loc_y'][~loc_x_zero] / raw['loc_x'][~loc_x_zero])
raw['angle'][loc_x_zero] = np.pi / 2
还有多少分钟,多少秒结束,这两列也可以结合在一起:
raw['remaining_time'] = raw['minutes_remaining'] * 60 + raw['seconds_remaining']
快速观察数据:有些特征包含的属性太多,这里可以通过以下操作看一下包括哪些:
print(kobe.action_type.unique()) #打印属性
print(kobe.combined_shot_type.unique())
print(kobe.shot_type.unique())
print(kobe.shot_type.value_counts())#打印每个属性有多少个值
[‘Jump Shot’ ‘Driving Dunk Shot’ ‘Layup Shot’ ‘Running Jump Shot’
‘Reverse Dunk Shot’ ‘Slam Dunk Shot’ ‘Driving Layup Shot’
‘Turnaround Jump Shot’ ‘Reverse Layup Shot’ ‘Tip Shot’
‘Running Hook Shot’ ‘Alley Oop Dunk Shot’ ‘Dunk Shot’
‘Alley Oop Layup shot’ ‘Running Dunk Shot’ ‘Driving Finger Roll Shot’
‘Running Layup Shot’ ‘Finger Roll Shot’ ‘Fadeaway Jump Shot’
‘Follow Up Dunk Shot’ ‘Hook Shot’ ‘Turnaround Hook Shot’ ‘Jump Hook Shot’
‘Running Finger Roll Shot’ ‘Jump Bank Shot’ ‘Turnaround Finger Roll Shot’
‘Hook Bank Shot’ ‘Driving Hook Shot’ ‘Running Tip Shot’
‘Running Reverse Layup Shot’ ‘Driving Finger Roll Layup Shot’
‘Fadeaway Bank shot’ ‘Pullup Jump shot’ ‘Finger Roll Layup Shot’
‘Turnaround Fadeaway shot’ ‘Driving Reverse Layup Shot’
‘Driving Slam Dunk Shot’ ‘Step Back Jump shot’ ‘Turnaround Bank shot’
‘Reverse Slam Dunk Shot’ ‘Floating Jump shot’ ‘Putback Slam Dunk Shot’
‘Running Bank shot’ ‘Driving Bank shot’ ‘Driving Jump shot’
‘Putback Layup Shot’ ‘Putback Dunk Shot’ ‘Running Finger Roll Layup Shot’
‘Pullup Bank shot’ ‘Running Slam Dunk Shot’ ‘Cutting Layup Shot’
‘Driving Floating Jump Shot’ ‘Running Pull-Up Jump Shot’ ‘Tip Layup Shot’
‘Driving Floating Bank Jump Shot’]
[‘Jump Shot’ ‘Dunk’ ‘Layup’ ‘Tip Shot’ ‘Hook Shot’ ‘Bank Shot’]
[‘2PT Field Goal’ ‘3PT Field Goal’]
2PT Field Goal 20285
3PT Field Goal 5412
Name: shot_type, dtype: int64
还有的数据不仅包含数值还包含特殊符号,例如下面的,机器学习算法不能识别:
kobe['season'].unique()
array([‘2000-01’, ‘2001-02’, ‘2002-03’, ‘2003-04’, ‘2004-05’, ‘2005-06’, ‘2006-07’, ‘2007-08’, ‘2008-09’, ‘2009-10’, ‘2010-11’, ‘2011-12’, ‘2012-13’, ‘2013-14’, ‘2014-15’, ‘2015-16’, ‘1996-97’, ‘1997-98’, ‘1998-99’, ‘1999-00’], dtype=object)
所以将其转换为整型数据:
#首先对里面每个值按照'—'进行切分然后取其右边部分
raw['season'] = raw['season'].apply(lambda x: int(x.split('-')[1]) )
raw['season'].unique()
array([ 1, 2, 3, 4, 5, 6, 7, 8, 9, 10, 11, 12, 13, 14, 15, 16, 97,98, 99, 0], dtype=int64)
matchup代表A vs B,opponent代表B
pd.DataFrame({'matchup':kobe.matchup, 'opponent':kobe.opponent})

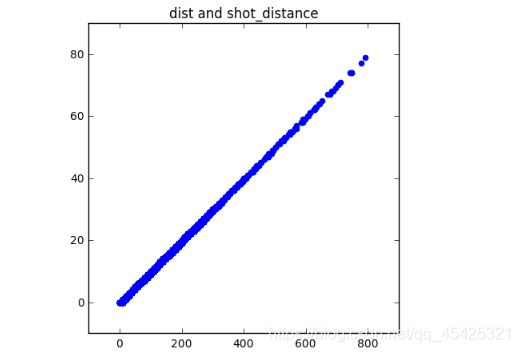
观察特征间是否存在极强的正相关,如果是就只保留一个。例如:dist刚刚计算加的,shot_distance原有的
plt.figure(figsize=(5,5))
plt.scatter(raw.dist, raw.shot_distance, color='blue')
plt.title('dist and shot_distance')

groupby数据归类:以某一列数据为Key对其他列进行相应计算
gs = kobe.groupby('shot_zone_area')
print (kobe['shot_zone_area'].value_counts())
print (len(gs))
Center© 11289
Right Side Center(RC) 3981
Right Side® 3859
Left Side Center(LC) 3364
Left Side(L) 3132
Back Court(BC) 72
Name: shot_zone_area, dtype: int64
6
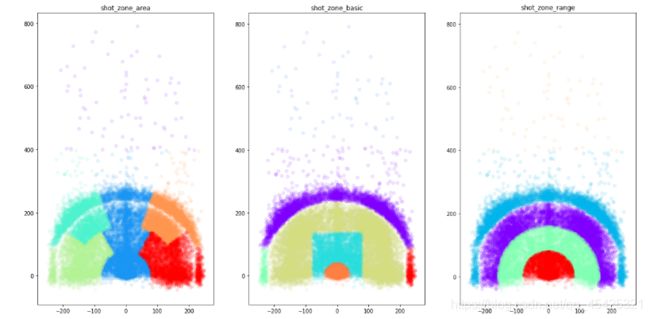
下面利用这一功能对科比出手不同位置上色:
import matplotlib.cm as cm
plt.figure(figsize=(20,10))

def scatter_plot_by_category(feat):
    alpha = 0.1
    gs = kobe.groupby(feat)#找出出手的几个地方
    cs = cm.rainbow(np.linspace(0, 1, len(gs)))#选几种颜色对应
    for g, c in zip(gs, cs):   #匹配(出手点:颜色)
        plt.scatter(g[1].loc_x, g[1].loc_y, color=c, alpha=alpha)

# shot_zone_area
plt.subplot(131)
scatter_plot_by_category('shot_zone_area')
plt.title('shot_zone_area')

# shot_zone_basic
plt.subplot(132)
scatter_plot_by_category('shot_zone_basic')
plt.title('shot_zone_basic')

# shot_zone_range
plt.subplot(133)
scatter_plot_by_category('shot_zone_range')
plt.title('shot_zone_range')

这三个属性都是表达出手位置,所以也只留一个。
按照上述思维,这里统一去除:
drops = ['shot_id', 'team_id', 'team_name', 'shot_zone_area', 'shot_zone_range', 'shot_zone_basic', \
         'matchup', 'lon', 'lat', 'seconds_remaining', 'minutes_remaining', \
         'shot_distance', 'loc_x', 'loc_y', 'game_event_id', 'game_id', 'game_date']
for drop in drops:
    raw = raw.drop(drop, 1)
有些列比如shot_zone_area里面都是些String值,这些列也要转换为整型,这里用的是ont_hot变换。
print (raw['combined_shot_type'].value_counts())
pd.get_dummies(raw['combined_shot_type'], prefix='combined_shot_type')[0:5]
# prefix前缀+属性名
Jump Shot 23485
Layup 5448
Dunk 1286
Tip Shot 184
Hook Shot 153
Bank Shot 141
Name: combined_shot_type, dtype: int64

把这些转换的数据有拼接到原数据上,这里统一操作了:
categorical_vars = ['action_type', 'combined_shot_type', 'shot_type', 'opponent', 'period', 'season']
for var in categorical_vars:
    raw = pd.concat([raw, pd.get_dummies(raw[var], prefix=var)], 1)#因为是列操作所以这里指定维度1
    raw = raw.drop(var, 1)#丢掉原列
二、Scikit-learn建立模型
指定训练集和测试集
train_kobe = raw[pd.notnull(raw['shot_made_flag'])]#构造训练输入特征
train_kobe = train_kobe.drop('shot_made_flag', 1)  #只保留特征
train_label = train_kobe['shot_made_flag']         #构造训练输入label
test_kobe = raw[pd.isnull(raw['shot_made_flag'])]  #把label空的拿来当测试集
test_kobe = test_kobe.drop('shot_made_flag', 1)    #只保留特征
这里用随机森林
from sklearn.ensemble import RandomForestRegressor    #导入随机森林分类器
from sklearn.metrics import confusion_matrix,log_loss #衡量标准:混淆矩阵+损失值
import time
找最佳参数:树木量和树深度
#看构造几棵树最合适
print('Finding best n_estimators for RandomForestClassifier...')
min_score = 100000
best_n = 0
scores_n = []
# np.linspace():等差序列
range_n = np.linspace(1, 100, num=10).astype(int)   #np.linspace(起始点,最终值,个数)
print(range_n)
# 列举10个数字,作为tree的棵树
for n in range_n:
    print("the number of trees : {0}".format(n))
    t1 = time.time()
    rfc_score = 0.
    rfc = RandomForestClassifier(n_estimators=n)
    kf = KFold(n_splits=10, shuffle=True)
    #交叉验证,然后取一个平均值
    for train_k, test_k in kf.split(train_kobe):
        rfc.fit(train_kobe.iloc[train_k], train_label.iloc[train_k])
        pred = rfc.predict(train_kobe.iloc[test_k])
        rfc_score += log_loss(train_label.iloc[test_k], pred) / 10
        #损失值衡量结果
    scores_n.append(rfc_score)
    if rfc_score < min_score:
        min_score = rfc_score
        best_n = n
    t2 = time.time()
    print('Done processing {0} trees ({1:.3f}sec)'.format(n, t2 - t1))
print(best_n, min_score)

# 找到最合适的树最大深度,避免分太细而过拟合
print('Finding best max_depth for RandomForestClassifier...')
min_score = 100000
best_m = 0
scores_m = []
range_m = np.logspace(0, 2, num=3).astype(int)
for m in range_m:
    print("the max depth : {0}".format(m))
    t1 = time.time()
    rfc_score = 0.
    rfc = RandomForestClassifier(max_depth=m, n_estimators=best_n)
    kf = KFold(n_splits=10, shuffle=True)
    for train_k, test_k in kf.split(train_kobe):
        rfc.fit(train_kobe.iloc[train_k], train_label.iloc[train_k])
        pred = rfc.predict(train_kobe.iloc[test_k])
        rfc_score += log_loss(train_label.iloc[test_k], pred) / 10
    scores_m.append(rfc_score)
    if rfc_score < min_score:
        min_score = rfc_score
        best_m = m
    t2 = time.time()
    print('Done processing {0} trees ({1:.3f}sec)'.format(m, t2 - t1))
print(best_m, min_score)
Finding best n_estimators for RandomForestClassifier…
[ 1 12 23 34 45 56 67 78 89 100]
the number of trees : 1
Done processing 1 trees (1.396sec)
the number of trees : 12
Done processing 12 trees (10.180sec)
the number of trees : 23
Done processing 23 trees (18.697sec)
the number of trees : 34
Done processing 34 trees (28.144sec)
the number of trees : 45
Done processing 45 trees (36.456sec)
the number of trees : 56
Done processing 56 trees (43.690sec)
the number of trees : 67
Done processing 67 trees (58.214sec)
the number of trees : 78
Done processing 78 trees (66.026sec)
the number of trees : 89
Done processing 89 trees (75.357sec)
the number of trees : 100
Done processing 100 trees (79.361sec)
78 11.80245918858669
Finding best max_depth for RandomForestClassifier…
the max depth : 1
Done processing 1 trees (5.326sec)
the max depth : 10
Done processing 10 trees (19.133sec)
the max depth : 100
Done processing 100 trees (60.647sec)
10 11.042990814663453
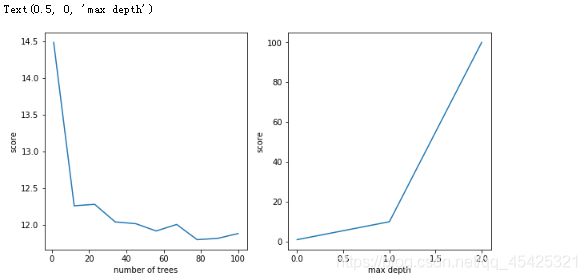
预测结果的参数和差异,进行可视化:
plt.figure(figsize=(10, 5))
plt.subplot(121)
plt.plot(range_n, scores_n)
plt.ylabel('score')
plt.xlabel('number of trees')
plt.subplot(122)
plt.plot(range_m)
plt.ylabel('score')
plt.xlabel('max depth')
model = RandomForestClassifier(n_estimators=best_n, max_depth=best_m)
model.fit(train_kobe, train_label)
个人补充:
logspace和linspace的区别:
y=logspace(a, b, n),功能是产生从10的a次方到10的b次方之间按对数等分的n个元素,参数endpoint=False则不计算b次方,参数base为底数默认为10可以指定其他值。
y = linspace(x1,x2,n),创建从 x1到 x2 之间等分的 n个数,参数retstep=True可以展示,参数endpoint功能同上。
x1 = np.logspace(0.1, 1, 10)
print(x1)
x2 = np.linspace(0, 10, 10)
print(x2)
y = np.zeros(10)
plt.plot(x1, y, 'o')
plt.plot(x2, y - 0.5, '*')
plt.ylim([-1, 0.5])
[ 1.25892541 1.58489319 1.99526231 2.51188643 3.16227766 3.98107171 5.01187234 6.30957344 7.94328235 10. ]
[ 0. 1.11111111 2.22222222 3.33333333 4.44444444 5.55555556 6.66666667 7.77777778 8.88888889 10. ]

