yolov5代码阅读笔记
文章目录
- Yolov5 代码笔记
- 1. train(hyp)函数重点部分
- 1.1 载入图片路径
- 1.2 创建模型
- 1.3 确定训练和测试图片的尺寸
- 1.4 根据参数的形式(是否为weight,是否为bias等)定义模型的不同部分,并为不同部分设置不同的学习率及参数
- 1.5 载入预训练模型(ckpt)及权重(ckpt['model'])
- 1.6 定义学习率变化趋势,这里采用的是Cosine Learning Rate Decay
- 1.7 载入数据集,定义数据集迭代器
- 1.8 定义训练集和验证集的数据读取器(dataloader和testloader),二者的区别是testloader使用的测试图片保留了原图的宽长比(即是个矩形输入),并且没有数据增强及Mosaic的过程(self.augment=False, self.mosaic=False)。
- 1.9 统计不同类别的样本数
- 1.10 开始训练
- 1.10.1 学习率warmup
- 1.10.2 计算loss (utils.py comput_loss函数)
- 1.10.3 计算验证集指标(test.py)
- 1.10.4 保存模型
- 2. 数据集文件 (dataset.py中class LoadImagesAndLabels)
- 2.1 生成图片列表(self.img_files)和标签列表(self.label_files)
- 2.2 快速有效地读取label信息
- 2.3 数据增强
- 2.3.1 Mosaic (dataset.py load_mosaic函数)
- 2.3.2 色彩空间hsv增强(dataset.py augment_hsv函数)
- 2.3.3 随机水平翻转和垂直翻转
- 3. 模型文件 (yolo.py)
- 3.1 parse_model函数,读入模型yaml中的参数定义
- 3.1.1 执行对应的模块
- 3.1.2 对网络组件进行处理,生成所需要的格式
- 3.2 class Model
- 3.3 class Detector
- 4. Loss函数(utils.py compute_loss函数)
- 4.1 build_targets函数
- 4.2 giou loss
- 4.3 class loss和obj loss
- 5. Q & A
- 5.1 Focus模块是什么?
- 5.2 输入尺寸和Focus模块的第一个卷积层尺寸不对应的问题
- 5.3 build_targets那块不是特别理解,我大概的理解是通过一个阈值去选了部分的anchors,还有待明确。
博客中每个字都是自己码的,图也是自己画的,转载或使用请征得同意。谢谢。
Yolov5 代码笔记
Yolov5源码:https://github.com/ultralytics/yolov5
该笔记主要对四个函数的重点部分进行分析,分别是train.py中的train(hyp)函数,数据集整理dataset.py,模型文件yolo.py及loss函数计算utils.py中的compute_loss函数。
1. train(hyp)函数重点部分
1.1 载入图片路径
# Configure
init_seeds(1)
with open(opt.data) as f:
	data_dict = yaml.load(f, Loader=yaml.FullLoader)  # model dict
train_path = data_dict['train']
test_path = data_dict['val']
nc = 1 if opt.single_cls else int(data_dict['nc'])  # number of classes
1.2 创建模型
model = Model(opt.cfg).to(device)
1.3 确定训练和测试图片的尺寸
imgsz, imgsz_test = [make_divisible(x, gs) for x in opt.img_size] # image sizes (train, test)
1.4 根据参数的形式(是否为weight,是否为bias等)定义模型的不同部分,并为不同部分设置不同的学习率及参数
imgsz, imgsz_test = [make_divisible(x, gs) for x in opt.img_size] # image sizes (train, test)
1.5 载入预训练模型(ckpt)及权重(ckpt[‘model’])
if weights.endswith('.pt'):  # pytorch format
    ckpt = torch.load(weights, map_location=device)  # load checkpoint
    # load model
    try:
        ckpt['model'] = {k: v for k, v in ckpt['model'].state_dict().items() if model.state_dict()[k].numel() == v.numel()}
        model.load_state_dict(ckpt['model'], strict=False)
1.6 定义学习率变化趋势,这里采用的是Cosine Learning Rate Decay
# Scheduler https://arxiv.org/pdf/1812.01187.pdf
lf = lambda x: (((1 + math.cos(x * math.pi / epochs)) / 2) ** 1.0) * 0.9 + 0.1  # cosine
scheduler = lr_scheduler.LambdaLR(optimizer, lr_lambda=lf)
scheduler.last_epoch = start_epoch - 1  # do not move
1.7 载入数据集,定义数据集迭代器
dataset = LoadImagesAndLabels(train_path, imgsz, batch_size,
                              augment=True,
                              hyp=hyp,  # augmentation hyperparameters
                              rect=opt.rect,  # rectangular training
                              cache_images=opt.cache_images,
                              single_cls=opt.single_cls)
1.8 定义训练集和验证集的数据读取器(dataloader和testloader),二者的区别是testloader使用的测试图片保留了原图的宽长比(即是个矩形输入),并且没有数据增强及Mosaic的过程(self.augment=False, self.mosaic=False)。
dataloader = torch.utils.data.DataLoader(dataset, batch_size=batch_size, num_workers=nw, shuffle=not opt.rect, pin_memory=True, collate_fn=dataset.collate_fn)

# Testloader
testloader=torch.utils.data.DataLoader(LoadImagesAndLabels(test_path, imgsz_test, batch_size, hyp=hyp, rect=True, cache_images=opt.cache_images, single_cls=opt.single_cls), batch_size=batch_size, num_workers=nw, pin_memory=True, collate_fn=dataset.collate_fn)
1.9 统计不同类别的样本数
labels = np.concatenate(dataset.labels, 0)
c = torch.tensor(labels[:, 0])  # classes
# cf = torch.bincount(c.long(), minlength=nc) + 1.
# model._initialize_biases(cf.to(device))
plot_labels(labels)
tb_writer.add_histogram('classes', c, 0)
# Exponential moving average
ema = torch_utils.ModelEMA(model)
1.10 开始训练
1.10.1 学习率warmup
for j, x in enumerate(optimizer.param_groups):
# bias lr falls from 0.1 to lr0, all other lrs rise from 0.0 to lr0
    x['lr'] = np.interp(ni, xi, [0.1 if j == 2 else 0.0, x['initial_lr'] * lf(epoch)])
    if 'momentum' in x:
        x['momentum'] = np.interp(ni, xi, [0.9, hyp['momentum']])
1.10.2 计算loss (utils.py comput_loss函数)
loss, loss_items = compute_loss(pred, targets.to(device), model)
1.10.3 计算验证集指标(test.py)
1.10.4 保存模型
2. 数据集文件 (dataset.py中class LoadImagesAndLabels)
2.1 生成图片列表(self.img_files)和标签列表(self.label_files)
2.2 快速有效地读取label信息
该类的__init__函数剩余的部分主要的目的就是解决快速有效读取label信息的问题。如果之前已经生成了代表label的npy文件,则直接读取。生成的npy的格式是一张图对应一个矩阵,如果一张图中有5个框,则矩阵的维度就是 5 × 5 5\times5 5×5。
如果数据集是第一次被训练,则首先会对所有labels进行缓存,这样后续读取label会比较快。
![]()
2.3 数据增强
2.3.1 Mosaic (dataset.py load_mosaic函数)
Mosaic数据增强的方法是随机挑选4张图构成一个大图,将大图输入后续流程。
Step 1 从 [ 0.5 × i m a g e _ s i z e , 1.5 × i m a g e _ s i z e ] [0.5 \times image\_size, 1.5 \times image\_size] [0.5×image_size,1.5×image_size]范围内随机选出 x c xc xc和 y c yc yc,这两个是大图的中心位置。
xc, yc = [int(random.uniform(s * 0.5, s * 1.5)) for _ in range(2)] # mosaic center x, y
Step 2 除了输入图片外,再随机挑选三张图片,索引号为indices。
indices = [index] + [random.randint(0, len(self.labels) - 1) for _ in range(3)] # 3 additional image indices
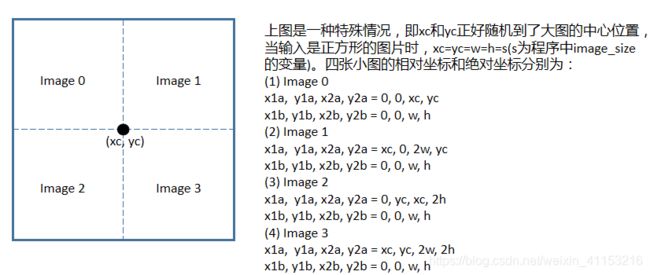
Step 3 把Step 2挑选的四张图片分别放在左上、左下、右上和右下四个位置。

图中i=0:3代表4张小图, x 1 a , y 1 a , x 2 a , y 2 a x1a, y1a, x2a,y2a x1a,y1a,x2a,y2a表示小图在大图中的位置(可以理解为小图在大图中的相对坐标), x 1 b , y 1 b , x 2 b , y 2 b x1b, y1b, x2b,y2b x1b,y1b,x2b,y2b表示小图自己的绝对坐标。
下图是两种情况下的相对坐标和绝对坐标说明。第一种是特殊情况,即随机到的xc和yc正好在大图的中心位置;而第二种情况是一般情况下的一种。图中的padw和padh用于Step 4的坐标变换。


Step 4 Mosaic小图中的坐标变换。

Step 5 对生成的坐标进行clip
np.clip(labels4[:, 1:], 0, 2 * s, out=labels4[:, 1:]) # use with random_affine
Step 6 对Mosaic之后的大图进行旋转,缩放等常规操作。假设图片尺寸为 640 × 640 × 3 640 \times 640 \times 3 640×640×3,经过Mosaic之后的尺寸是 1280 × 1280 × 3 1280 \times 1280 \times 3 1280×1280×3,经过旋转,缩放之后,图片尺寸又变为 640 × 640 × 3 640 \times 640 \times 3 640×640×3,这个尺寸也是输入网络的图片尺寸。

2.3.2 色彩空间hsv增强(dataset.py augment_hsv函数)
2.3.3 随机水平翻转和垂直翻转
3. 模型文件 (yolo.py)
3.1 parse_model函数,读入模型yaml中的参数定义
self.model, self.save = parse_model(self.md, ch=[ch])
3.1.1 执行对应的模块
m = eval(m) if isinstance(m, str) else m # eval strings
例如:运行eval(‘Focus’)会输出
3.1.2 对网络组件进行处理,生成所需要的格式
m_ = nn.Sequential(*[m(*args) for _ in range(n)]) if n > 1 else m(*args)  # module
t = str(m)[8:-2].replace('__main__.', '')  # module type
np = sum([x.numel() for x in m_.parameters()])  # number params
m_.i, m_.f, m_.type, m_.np = i, f, t, np  # attach index, 'from' index, type, number params
print('%3s%15s%3s%10.0f  %-40s%-30s' % (i, f, n, np, t, args))  # print
save.extend(x % i for x in ([f] if isinstance(f, int) else f) if x != -1)  # append to savelist
layers.append(m_)
ch.append(c2)
3.2 class Model
该class包括模型的主干网络,其中有一个比较重要的操作是计算stride(输入和特征图之间的尺度比值)。最后输出的是一个列表,列表的长度为3,代表的是darknet的3个尺度输出。这3个尺度的输出跟输入去求stride,这三层对应的层数是模型打印出来的[-1, 11, 16],其中-1代表从上一层接收到的输出。

3.3 class Detector
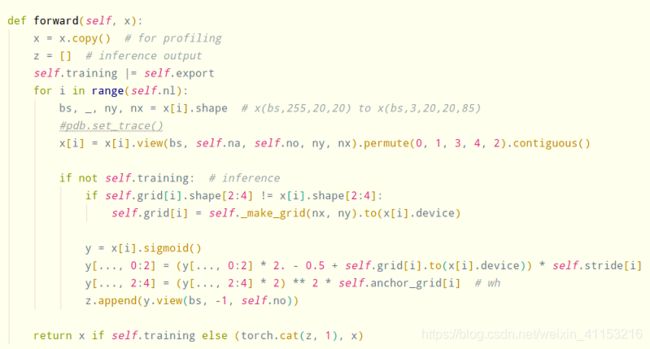
训练过程:当模型的输入图片尺寸为[1,3,64,64]时,Detector类的输入是2.2中产生的长度为3的列表,维度分别为[1,90,8,8], [1,90,4,4],[1,90,2,2]。Detector类的输出是把上述维度变成[1,3,30,8,8],[1,3,30,4,4],[1,3,30,2,2]。
测试过程:Detector类就要生成多个锚框(anchors),并且将这些anchors进行尺寸映射。

4. Loss函数(utils.py compute_loss函数)
4.1 build_targets函数
我理解的是对每一层(共3层)的anchors进行筛选,并最终选出有用的anchors
4.2 giou loss
4.3 class loss和obj loss
5. Q & A
5.1 Focus模块是什么?
5.2 输入尺寸和Focus模块的第一个卷积层尺寸不对应的问题
断点调试的时候发现,图片输出尺寸为(1, 3, 64, 64),但是第一个卷积层的Input_channel是12。我原来以为是Mosaic四张图的堆叠,但是仔细读了Mosaic部分的代码之后,觉得又不是。Github上问了作者,也没得到答复。他在别的Issue里说年底会公布文章,只有等他的文章了,不知道会不会对这个问题有解释。


