机器学习——反馈神经网络多分类
本次主要实践利用反馈神经网络做多分类,包括图片数据可视化,模型训练等,反馈神经部分主要参考该博主的文章,在此感谢。
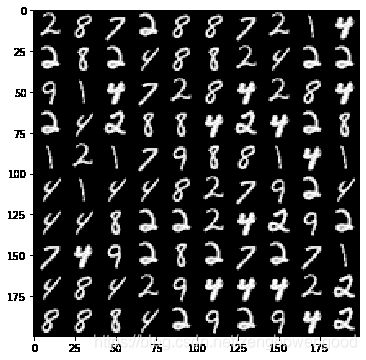
- 读取数据和可视化
import numpy as np #导入数值计算模块
import scipy.io as sio #导入scipy的io类用来加载matlab文件
data = sio.loadmat("CourseraML/ex3/data/ex3data1.mat")  #读取matlab图片数据
X, y = data["X"], data["y"] #拆分特征和标签
#X = np.insert(X, 0, 1, axis = 1) #增加截距列
#print(X.shape, np.unique(y)) #(5000, 401) [ 1  2  3  4  5  6  7  8  9 10]

from PIL import Image
import matplotlib.cm as cm #Used to display images in a specific colormap
import matplotlib.pyplot as plt
import random
random_samples = [random.randint(0,5000) for _ in range(10)] #从5000个样本随机抽100个
print(random_samples)
def dispData(): #数据可视化
    fig = plt.figure(figsize = (6, 6)) #新建画布
    height, width = 20, 20
    rows, cols = 10, 10
    palette = np.zeros((height*rows, width*cols)) #200*200画板
    for col in range(cols):
        for row in range(rows):
            palette[height*col:height*col+height, width*row:width*row+width]= X[random.sample(random_samples, 1)].reshape(height, width).T
    Img = Image.fromarray((palette * 5).astype('uint8'),mode = "L") #清晰图像,通过系数5调节清晰度
    plt.imshow(Img,cmap = cm.Greys_r)

dispData()
- 标签编码
def encoder(myy): #定义标签编码函数
    temp =[] #5000个标签,每个标签10维
    for i in myy:
        yi = np.zeros(10)
        yi[i-1] = 1
        temp.append(yi)
    return np.array(temp)
y_encoded = encoder(y)
#print(y[2000], y_encoded[2000]) #5000*10
- 激活函数与向前传播
def sigmoid(z): #定义激活函数
    return 1/( 1 + np.exp(-z))

def forwardPropagation(myx, mytheta1, mytheta2): #定义向前传播函数
    a1 = np.insert(myx, 0, 1, axis =1)
    z2 = np.dot(a1, mytheta1.T)
    a2 = np.insert(sigmoid(z2), 0, 1, axis=1)
    z3 = np.dot(a2, mytheta2.T)
    h = sigmoid(z3)
    return a1, z2, a2, z3, h
- 反馈传播
def sigmoid_gradient(z): #定义激活函数的导数
    return np.multiply(sigmoid(z), (1-sigmoid(z)))

def backPropagation(params, input_size, hidden_size, num_labels, myX, myy, l): #定义反向传播函数
    m = myX.shape[0]
    X = np.matrix(myX)
    y = np.matrix(myy)
    theta1 = np.matrix(np.reshape(params[:hidden_size*(input_size + 1)], (hidden_size, (input_size + 1))))
    theta2 = np.matrix(np.reshape(params[hidden_size * (input_size + 1):], (num_labels, (hidden_size + 1))))

    a1, z2, a2, z3, h = forwardPropagation(X, theta1, theta2) #向前传播

    J = 0
    delta1 = np.zeros(theta1.shape)
    delta2 = np.zeros(theta2.shape)
    for i in range(m):
        term1  = np.multiply(-y[i,:], np.log(h[i,:]))
        term2 = np.multiply((1-y[i,:]), np.log(1-h[i,:]))
        J += np.sum(term1 - term2)

    J = J/m
    J += 1/(2*m)*(np.sum(np.power(theta1[:,1:], 2)) + np.sum(np.power(theta2[:,1:], 2))) #添加正则项

    for t in range(m):
        a1t = a1[t, :] # (1, 401)
        z2t = z2[t, :] # # (1, 25)
        a2t = a2[t, :] ## (1, 26)

        ht = h[t, :] # (1, 10)
        yt = y[t, :] # (1, 10)

        d3t = ht - yt # (1, 10)

        z2t = np.insert(z2t, 0, 1, axis = 1)
        d2t = np.multiply((theta2.T*d3t.T).T, sigmoid_gradient(z2t))

        delta1 = delta1 +(d2t[:,1:]).T*a1t
        delta2 = delta2 + d3t.T*a2t

    delta1 = delta1/m
    delta2 = delta2/m

    delta1[:,1:] = delta1[:, 1:] + (theta1[:, 1:]*1)/m
    delta2[:,1:] = delta2[:, 1:] + (theta2[:, 1:]*1)/m
    grad = np.concatenate((np.ravel(delta1), np.ravel(delta2)))
    return J, grad
- 参数初始化与各层维度验证
input_size = 400
hidden_size = 25
num_labels = 10
l = 1

params = (np.random.random(size=hidden_size * (input_size + 1) + num_labels * (hidden_size + 1))-0.5)*0.25 # 随机初始化完整网络参数

m = X.shape[0]
X = np.matrix(X)
y = np.matrix(y)

# 将参数数组解开为每个层的参数矩阵
theta1 = np.matrix(np.reshape(params[:hidden_size * (input_size + 1)], (hidden_size, (input_size + 1))))
theta2 = np.matrix(np.reshape(params[hidden_size * (input_size + 1):], (num_labels, (hidden_size + 1))))
print(theta1.shape, theta2.shape)

a1, z2, a2, z3, h = forwardPropagation(X, theta1, theta2)
print(a1.shape, z2.shape, a2.shape, z3.shape, h.shape)
- 最优化参数
from scipy.optimize import minimize

fmin = minimize(fun = backPropagation, x0 = params, args = (input_size, hidden_size, num_labels, X, y_encoded, l),
               method = "TNC", jac = True, options = {"maxiter":1000})

X = np.matrix(X)
theta1 = np.matrix(np.reshape(fmin.x[:hidden_size*(input_size + 1)], (hidden_size, (input_size + 1)))) #(25, 401)
theta2 = np.matrix(np.reshape(fmin.x[hidden_size * (input_size + 1):], (num_labels, (hidden_size + 1)))) #(10, 26)

a1, z2, a2, z3, h = forwardPropagation(X, theta1, theta2)
y_pred = np.argmax(h, axis =1)+1
#print(y_pred)
- 评估
y_pred = [x if x else 10 for x in y_pred]

n_correct, n_total = 0, 0 #正确数,总数
for row in range(len(y_pred)):
    n_total +=1
    if y_pred[row] == y[row]:
        n_correct +=1 #正确数加1
accuarcy = np.round(n_correct/n_total,3)
print("The accuarcy is {}%".format(accuarcy*100))
The accuarcy is 99.6%
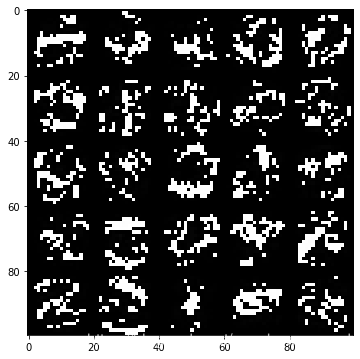
- 隐藏层可视化
def hiddenVisualization(mytheta): #定义隐藏层可视化函数
    mytheta1, mytheta2 = mytheta[:25*401].reshape(25, 401) , mytheta[25*401:].reshape(10,26)
    hidden_layer = mytheta1[:,1:] #去掉偏置单元

    fig = plt.figure(figsize = (6, 6)) #新建画布
    height, width = 20, 20
    rows, cols = 5, 5
    hidden_palette = np.zeros((height*5, height*5)) #100*100画板
    for col in range(cols):
        for row in range(rows):
            hidden_palette[height*col:height*col+height, width*row:width*row+width]= hidden_layer[5*row+col].reshape(height, width).T #用抽取出来的样本数据填坑
    Img = Image.fromarray((hidden_palette * 5).astype('uint8'),mode = "L") #清晰图像,通过系数5调节清晰度
    plt.imshow(Img, cmap = cm.Greys_r)
    plt.show()
hiddenVisualization(fmin.x)
你们能看出什么名堂吗?好像有点意思
延伸阅读
机器学习——神经网络多分类
机器学习——逻辑回归多分类
机器学习——逻辑回归正则(二)
机器学习——逻辑回归不正则(一)
机器学习——多元线性回归模型
机器学习——单变量线性回归模型

