Python数据可视化第 10 讲:matplotlib散点图绘制函数scatter
1. scatter 函数介绍
scatter 函数用于绘制散点图,调用形式如下:
scatter(x, y, s, c, **kwargs)
scatter(x, **kwargs)
scatter(x)
参数说明:
- x, y:标量或数组,必须参数,用于标定散点的坐标(x, y)。
- s:标量或数组,可选参数,用于设置散点的大小。
- c:颜色序列,可选参数,用于设置散点的颜色。
- marker:散点样式,可选参数。
- kwargs:其它可选参数,用于设置一些辅助特性。
2. scatter 函数绘图示例
2.1 绘制一个简单的散点图
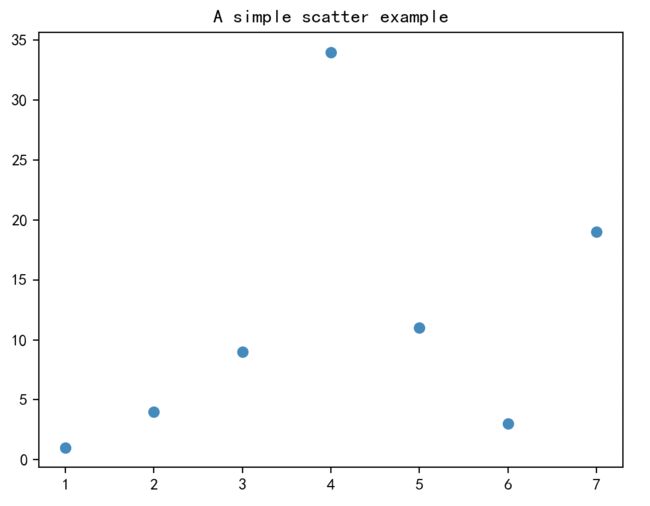
绘制一个简单的散点图,完整代码如下:
import matplotlib.pyplot as plt

# step1:准备画图的数据
x = [1, 2, 3, 4, 5, 6, 7]
y = [1, 4, 9, 34, 11, 3, 19]

# step2:手动创建一个figure对象,相当于一个空白的画布
fig = plt.figure()
# step3:在画布上添加1个子块,标定绘图位置
ax1 = fig.add_subplot(1, 1, 1)
# step4: 绘图
ax1.scatter(x, y, marker='o')
ax1.set_title('A simple scatter example')
# 展示
plt.show()
上面代码的运行结果:
2.2 绘制一个彩色的散点图
绘制一个彩色的散点图,完整代码如下:
import matplotlib.pyplot as plt
import numpy as np

# step1:准备画图的数据
rx, ry = 3., 1.
area = rx * ry * np.pi
theta = np.arange(0, 2 * np.pi + 0.01, 0.1)
verts = np.column_stack([rx / area * np.cos(theta), ry / area * np.sin(theta)])
x, y, s, c = np.random.rand(4, 30)
s *= 10 ** 2.

# step2:手动创建一个figure对象,相当于一个空白的画布
fig = plt.figure()
# step3:在画布上添加1个子块,标定绘图位置
ax1 = fig.add_subplot(1, 1, 1)
# step4: 绘图
ax1.scatter(x, y, s, c, marker=verts)

# 展示
plt.show()
上面代码的运行结果:
2.3 绘制半径变化的散点图
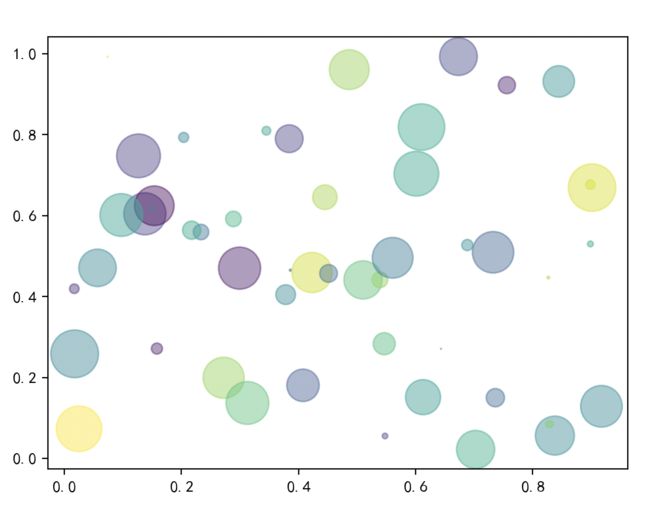
通过随机数控制散点的颜色和半径,绘制散点图,完整如下:
import matplotlib.pyplot as plt
import numpy as np

# step1:准备画图的数据
N = 50
x = np.random.rand(N)
y = np.random.rand(N)
colors = np.random.rand(N)
area = (30 * np.random.rand(N)) ** 2  # 半径在0~15之间随机变化

# step2:手动创建一个figure对象,相当于一个空白的画布
fig = plt.figure()
# step3:在画布上添加1个子块,标定绘图位置
ax1 = fig.add_subplot(1, 1, 1)
# step4: 绘图
ax1.scatter(x, y, s=area, c=colors, alpha=0.5)

# 展示
plt.show()
上面代码的运行结果:
2.4 绘制复合散点图
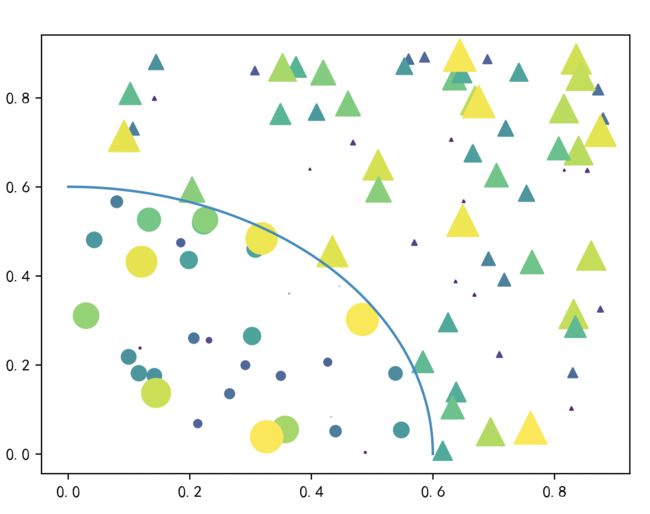
在一个坐标系内绘制两种散点图,并添加一条线去标记两种散点的分割线,完整代码示例如下:
import matplotlib.pyplot as plt
import numpy as np

# step1:准备画图的数据
np.random.seed(19680801)
N = 100
r0 = 0.6
x = 0.9 * np.random.rand(N)
y = 0.9 * np.random.rand(N)
area = (20 * np.random.rand(N)) ** 2  # 0 to 10 point radii
c = np.sqrt(area)
r = np.sqrt(x ** 2 + y ** 2)
area1 = np.ma.masked_where(r < r0, area)
area2 = np.ma.masked_where(r >= r0, area)

# step2:手动创建一个figure对象,相当于一个空白的画布
fig = plt.figure()
# step3:在画布上添加1个子块,标定绘图位置
ax1 = fig.add_subplot(1, 1, 1)
# step4: 绘图散点图
ax1.scatter(x, y, s=area1, marker='^', c=c)
ax1.scatter(x, y, s=area2, marker='o', c=c)

# 绘制线条,显示区域之间的边界
theta = np.arange(0, np.pi / 2, 0.01)
plt.plot(r0 * np.cos(theta), r0 * np.sin(theta))

# 展示
plt.show()
上面代码的运行结果:


