matplotlib绘制折线图与散点图
# -*- coding: utf-8 -*-
import numpy as np
import matplotlib.pyplot as plt
#折线图,figure_no表示显示图的顺序
def simple_line_plot(x,y,figure_no):
plt.figure(figure_no)
plt.plot(x,y)
plt.xlabel('x values')
plt.ylabel('y values')
plt.title('Simple Line')
plt.xlabel('x values')
plt.ylabel('y values')
plt.title('Simple Dots')
plt.figure(figure_no)
plt.scatter(x,y)
plt.xlabel('x values')
plt.ylabel('y values')
plt.title('Simple scatter')
plt.xlabel('x values')
plt.ylabel('y values')
plt.title('Simple with color')
x=np.arange(1,100,dtype=float)
#y=np.array([np.power(xx,2) for xx in x])
y=np.sqrt(x)
figure_no=1
simple_line_plot(x,y,figure_no)
figure_no+=1
simple_dots(x,y,figure_no)
x=np.random.uniform(size=100)
#y=np.random.uniform(size=100)
y=x+1
x1=np.random.uniform(size=100)
#y=np.random.uniform(size=100)
y1=x+100
figure_no+=1
simple_scatter(x,y,figure_no)
simple_scatter(x1,y1,figure_no)
scatter_with_color(x,y,label,figure_no)
plt.show()


import numpy as np
import matplotlib.pyplot as plt
#折线图,figure_no表示显示图的顺序
def simple_line_plot(x,y,figure_no):
plt.figure(figure_no)
plt.plot(x,y)
plt.xlabel('x values')
plt.ylabel('y values')
plt.title('Simple Line')
def simple_dots(x,y,figure_no):
plt.figure(figure_no)
#设置线的形状为+,颜色为b蓝色
plt.plot(x,y,'+b')plt.xlabel('x values')
plt.ylabel('y values')
plt.title('Simple Dots')
#散点图
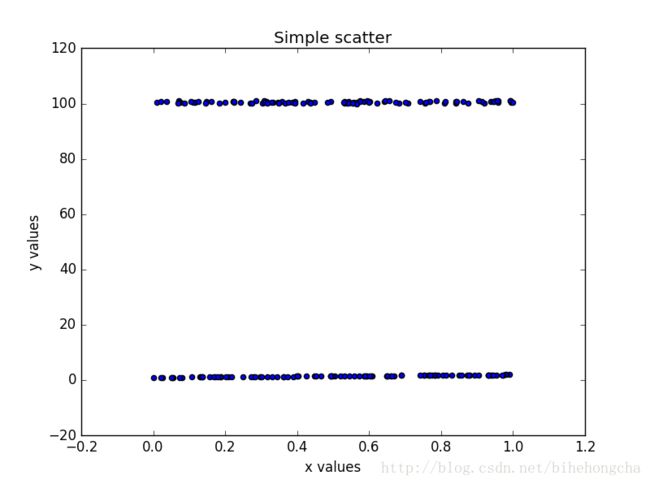
def simple_scatter(x,y,figure_no):plt.figure(figure_no)
plt.scatter(x,y)
plt.xlabel('x values')
plt.ylabel('y values')
plt.title('Simple scatter')
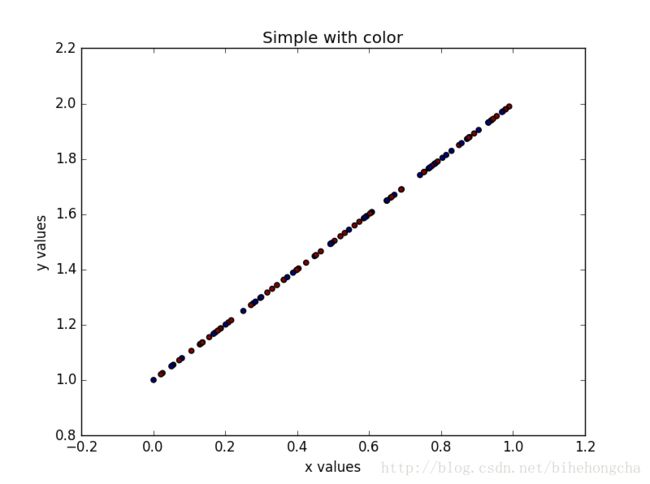
def scatter_with_color(x,y,labels,figure_no):
plt.figure(figure_no)
#设置不同颜色
plt.scatter(x,y,c=labels)plt.xlabel('x values')
plt.ylabel('y values')
plt.title('Simple with color')
if __name__=="__main__":
#清除之前的图片
plt.close('all')x=np.arange(1,100,dtype=float)
#y=np.array([np.power(xx,2) for xx in x])
y=np.sqrt(x)
figure_no=1
simple_line_plot(x,y,figure_no)
figure_no+=1
simple_dots(x,y,figure_no)
x=np.random.uniform(size=100)
#y=np.random.uniform(size=100)
y=x+1
x1=np.random.uniform(size=100)
#y=np.random.uniform(size=100)
y1=x+100
figure_no+=1
simple_scatter(x,y,figure_no)
simple_scatter(x1,y1,figure_no)
figure_no+=1
#参生100个随机的0或1,设置颜色
label=np.random.randint(2,size=100)scatter_with_color(x,y,label,figure_no)
plt.show()


