预测纽约出租车行程时间
机器学习案例详解的直播互动平台——
机器学习训练营(入群联系qq:2279055353)
下期直播案例预告:大数据预测商品的销售量波动趋势
案例简介
本案例要求根据乘客的旅程属性,建立一个模型预测纽约市出租车的行程时间,相关数据集来自Google云平台。该案例使用R语言编码。
我们的解决方案将分成以下三步进行:
-
可视化数据集,加工新特征,检查离群点。
-
增加外部数据集
-
XGBoost分类模型
数据描述
数据由1.5M的训练观测train.csv和630K的检验观测test.csv组成。每行观测代表一个乘车旅程。
介绍
加载R包和函数
首先,我们加载必需的R包。
library('ggplot2') # visualisation
library('scales') # visualisation
library('grid') # visualisation
library('RColorBrewer') # visualisation
library('corrplot') # visualisation
library('alluvial') # visualisation
library('dplyr') # data manipulation
library('readr') # input/output
library('data.table') # data manipulation
library('tibble') # data wrangling
library('tidyr') # data wrangling
library('stringr') # string manipulation
library('forcats') # factor manipulation
library('lubridate') # date and time
library('geosphere') # geospatial locations
library('leaflet') # maps
library('leaflet.extras') # maps
library('maps') # maps
library('xgboost') # modelling
library('caret') # modelling
然后,我们定义一个多图函数,该函数将在可视化时使用。
# Define multiple plot function
#
# ggplot objects can be passed in ..., or to plotlist (as a list of ggplot objects)
# - cols:   Number of columns in layout
# - layout: A matrix specifying the layout. If present, 'cols' is ignored.
#
# If the layout is something like matrix(c(1,2,3,3), nrow=2, byrow=TRUE),
# then plot 1 will go in the upper left, 2 will go in the upper right, and
# 3 will go all the way across the bottom.
#

multiplot <- function(..., plotlist=NULL, file, cols=1, layout=NULL) {

  # Make a list from the ... arguments and plotlist
  plots <- c(list(...), plotlist)

  numPlots = length(plots)

  # If layout is NULL, then use 'cols' to determine layout
  if (is.null(layout)) {
    # Make the panel
    # ncol: Number of columns of plots
    # nrow: Number of rows needed, calculated from # of cols
    layout <- matrix(seq(1, cols * ceiling(numPlots/cols)),
                    ncol = cols, nrow = ceiling(numPlots/cols))
  }

 if (numPlots==1) {
    print(plots[[1]])
  } else {
    # Set up the page
    grid.newpage()
    pushViewport(viewport(layout = grid.layout(nrow(layout), ncol(layout))))

    # Make each plot, in the correct location
    for (i in 1:numPlots) {
      # Get the i,j matrix positions of the regions that contain this subplot
      matchidx <- as.data.frame(which(layout == i, arr.ind = TRUE))

      print(plots[[i]], vp = viewport(layout.pos.row = matchidx$row,
                                      layout.pos.col = matchidx$col))
    }
  }
}
加载数据
这里,我们使用data.table包的fread函数,加快数据的读取。
train <- as.tibble(fread('../input/nyc-taxi-trip-duration/train.csv'))
test <- as.tibble(fread('../input/nyc-taxi-trip-duration/test.csv'))
查看数据
让我们来观察一下训练集和检验集的数据分布和变量类型等信息。以训练集为例:
summary(train)
glimpse(train)
-
vendor_id只取1, 2两个值,代表两个不同的出租车公司。 -
pickup_datetimeanddropoff_datetime由日期和时间组成,最好拆分成更有用的形式。 -
passenger_count中位数是1, 最大值是9. -
store_and_fwd_flag用来标识是否出租车行程数据被立即传到出租车公司(‘N’), 或者由于没有连接网络而保存在车上(‘Y’). 这个变量可能反映了信号盲区。 -
trip_duration是训练集里的目标特征,检验集里的预测特征。
缺失值
我们检查数据里是否包括缺失值。
sum(is.na(train))
sum(is.na(test))
0
合并训练集和检验集
我们合并训练集和检验集的目的是,有些在这两个数据集上的操作是相同的。
combine <- bind_rows(train %>% mutate(dset = "train"),
                     test %>% mutate(dset = "test",
                                     dropoff_datetime = NA,
                                     trip_duration = NA))
combine <- combine %>% mutate(dset = factor(dset))
特征类型转换
为了方便后续分析,我们将表示日期的字符特征转换为date型,重新定义vendor_id为因子型,这样做是为了方便可视化时分属不同类别的特征。
train <- train %>%
  mutate(pickup_datetime = ymd_hms(pickup_datetime),
         dropoff_datetime = ymd_hms(dropoff_datetime),
         vendor_id = factor(vendor_id),
         passenger_count = factor(passenger_count))
一致性检查
我们检查trip_durations是否在区间[pickup_datetime, dropoff_datetime]里。如果不一致,检查变量返回TRUE.
train %>%
  mutate(check = abs(int_length(interval(dropoff_datetime,pickup_datetime)) + trip_duration) > 0) %>%
  select(check, pickup_datetime, dropoff_datetime, trip_duration) %>%
  group_by(check) %>%
  count()
检查结果值为FALSE, 说明没有不一致的区间。
特征可视化
特征分布、关系的可视化分析,对于理解数据是重要的手段。我们建议从不同的视角检查数据,不放过细节和关系。在这部分,我们想从查看特征(变量)的分布入手。
我们从纽约市地图开始,地图覆盖上车的坐标位置。这需要用到leaflet包,该包包括很多交互式的地图访问函数。你可以在交互式地图上缩放位置。
set.seed(1234)
foo <- sample_n(train, 8e3)

leaflet(data = foo) %>% addProviderTiles("Esri.NatGeoWorldMap") %>%
  addCircleMarkers(~ pickup_longitude, ~pickup_latitude, radius = 1,
                   color = "blue", fillOpacity = 0.3)

地图显示,几乎所有的行程都是在曼哈顿,另一个热点是位于城市东南方的肯尼迪机场。我们再来看一看目标特征trip_duration的分布。
train %>%
  ggplot(aes(trip_duration)) +
  geom_histogram(fill = "red", bins = 150) +
  scale_x_log10() +
  scale_y_sqrt()
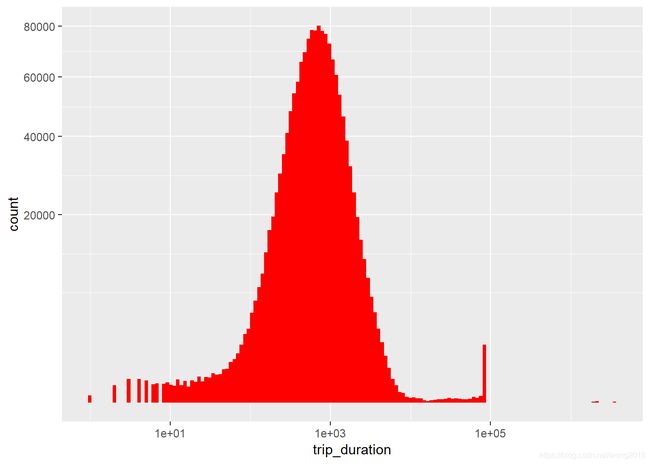
注意:关于该直方图的数据,x轴取对数,y轴取算术平方根。我们发现:
-
大多数点在对数正态内,峰值出现在1000(秒),即,大约17分钟。
-
有几个短行程小于10秒。
-
在
1e5秒之前有一个奇怪的delta状的峰。
train %>%
  arrange(desc(trip_duration)) %>%
  select(trip_duration, pickup_datetime, dropoff_datetime, everything()) %>%
  head(10)
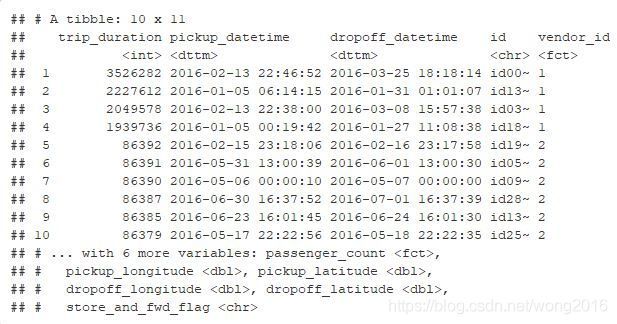
这些记录显示的是超过24小时的行程,最大的甚至达到12天。我们再来看看上、下车日期时间的分布。
p1 <- train %>%
  ggplot(aes(pickup_datetime)) +
  geom_histogram(fill = "red", bins = 120) +
  labs(x = "Pickup dates")

p2 <- train %>%
  ggplot(aes(dropoff_datetime)) +
  geom_histogram(fill = "blue", bins = 120) +
  labs(x = "Dropoff dates")

layout <- matrix(c(1,2),2,1,byrow=FALSE)
multiplot(p1, p2, layout=layout)

以上图仅能看到日、周的行程时间变化,让我们再看一看其它变量的分布。
p1 <- train %>%
  group_by(passenger_count) %>%
  count() %>%
  ggplot(aes(passenger_count, n, fill = passenger_count)) +
  geom_col() +
  scale_y_sqrt() +
  theme(legend.position = "none")

p2 <- train %>%
  ggplot(aes(vendor_id, fill = vendor_id)) +
  geom_bar() +
  theme(legend.position = "none")

p3 <- train %>%
  ggplot(aes(store_and_fwd_flag)) +
  geom_bar() +
  theme(legend.position = "none") +
  scale_y_log10()

p4 <- train %>%
  mutate(wday = wday(pickup_datetime, label = TRUE)) %>%
  group_by(wday, vendor_id) %>%
  count() %>%
  ggplot(aes(wday, n, colour = vendor_id)) +
  geom_point(size = 4) +
  labs(x = "Day of the week", y = "Total number of pickups") +
  theme(legend.position = "none")

p5 <- train %>%
  mutate(hpick = hour(pickup_datetime)) %>%
  group_by(hpick, vendor_id) %>%
  count() %>%
  ggplot(aes(hpick, n, color = vendor_id)) +
  geom_point(size = 4) +
  labs(x = "Hour of the day", y = "Total number of pickups") +
  theme(legend.position = "none")

layout <- matrix(c(1,2,3,4,5,5),3,2,byrow=TRUE)
multiplot(p1, p2, p3, p4, p5, layout=layout)

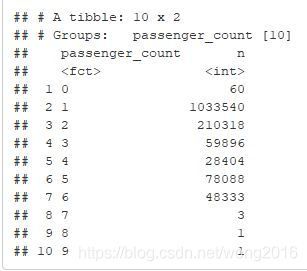
我们发现,有几个行程的乘客数是0, 几乎没有乘客数7~9的行程。我们统计一下不同乘客数的行程数。
p1 <- 1; p2 <- 1; p3 <- 1; p4 <- 1; p5 <- 1

train %>%
  group_by(passenger_count) %>%
  count()
-
大多数行程只有一个乘客,其次是两个乘客的。
-
Vendor 2的行程数大于vendor 1的,按天统计也有相同的趋势。
特征关系
现在,我们将检查特征之间的关系,以及它们与目标特征trip_duration的关系。
Pickup date/time vs trip_duration
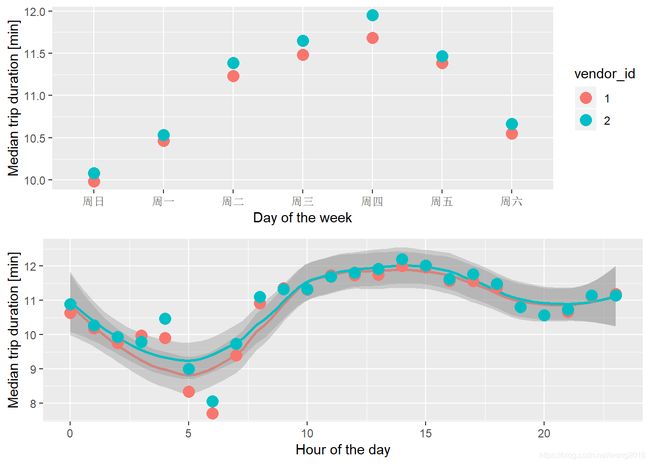
乘车的星期影响乘车时间吗?
p1 <- train %>%
  mutate(wday = wday(pickup_datetime, label = TRUE)) %>%
  group_by(wday, vendor_id) %>%
  summarise(median_duration = median(trip_duration)/60) %>%
  ggplot(aes(wday, median_duration, color = vendor_id)) +
  geom_point(size = 4) +
  labs(x = "Day of the week", y = "Median trip duration [min]")

p2 <- train %>%
  mutate(hpick = hour(pickup_datetime)) %>%
  group_by(hpick, vendor_id) %>%
  summarise(median_duration = median(trip_duration)/60) %>%
  ggplot(aes(hpick, median_duration, color = vendor_id)) +
  geom_smooth(method = "loess", span = 1/2) +
  geom_point(size = 4) +
  labs(x = "Hour of the day", y = "Median trip duration [min]") +
  theme(legend.position = "none")

layout <- matrix(c(1,2),2,1,byrow=FALSE)
multiplot(p1, p2, layout=layout)
-
按星期来看,vendor 2一直地高与vendor 1. 因此,建议在模型里增加特征
vendor_id. -
按小时来看,行车时间的峰值出现在午后14点,在早上5~6点最低。
-
weekdayandhour似乎是重要的预测特征,应该加入到模型里。
Passenger count and Vendor vs trip_duration
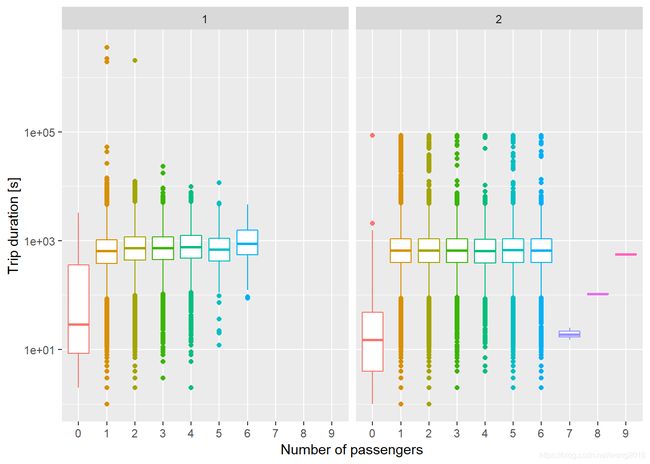
下一个问题是,乘客数和出租公司是否与目标变量有关?
train %>%
  ggplot(aes(passenger_count, trip_duration, color = passenger_count)) +
  geom_boxplot() +
  scale_y_log10() +
  theme(legend.position = "none") +
  facet_wrap(~ vendor_id) +
  labs(y = "Trip duration [s]", x = "Number of passengers")
-
两家公司都有没有乘客的短行程。
-
乘客数在1~6的行程时间中位数很接近,特别是vendor 2. vendor 1虽然有些差异,但考虑到取对数的原因,这些差异很小。
train %>%
  group_by(vendor_id) %>%
  summarise(mean_duration = mean(trip_duration),
            median_duration = median(trip_duration))
Store and Forward vs trip_duration
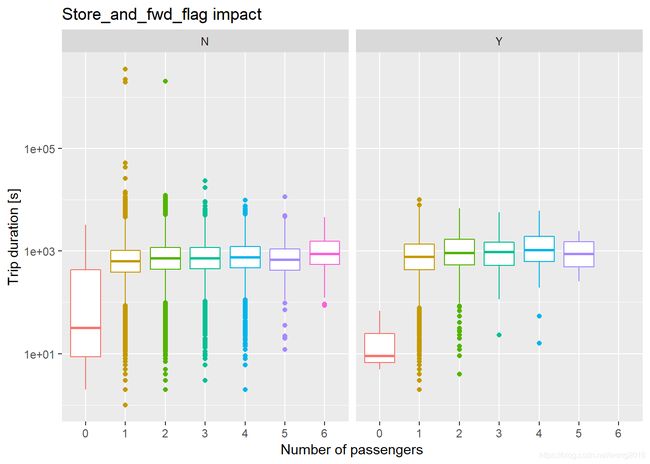
仅仅vendor 1有行程数据的临时存储。
train %>%

  group_by(vendor_id, store_and_fwd_flag) %>%

  count()
train %>%

  filter(vendor_id == 1) %>%

  ggplot(aes(passenger_count, trip_duration, color = passenger_count)) +

  geom_boxplot() +

  scale_y_log10() +

  facet_wrap(~ store_and_fwd_flag) +

  theme(legend.position = "none") +

  labs(y = "Trip duration [s]", x = "Number of passengers") +

  ggtitle("Store_and_fwd_flag impact")
特征工程
在这部分,我们将根据已有特征加工新的特征,目的是找到更好的预测变量。其中,新特征
date, month, wday, hour来自pickup_datetime. 根据维基百科得到JFK(肯尼迪),
La Guardia(拉瓜迪亚)机场的GPS坐标。blizzard根据外部天气信息得到。
jfk_coord <- tibble(lon = -73.778889, lat = 40.639722)

la_guardia_coord <- tibble(lon = -73.872611, lat = 40.77725)


pick_coord <- train %>%

  select(pickup_longitude, pickup_latitude)

drop_coord <- train %>%

  select(dropoff_longitude, dropoff_latitude)

train$dist <- distCosine(pick_coord, drop_coord)

train$bearing = bearing(pick_coord, drop_coord)


train$jfk_dist_pick <- distCosine(pick_coord, jfk_coord)

train$jfk_dist_drop <- distCosine(drop_coord, jfk_coord)

train$lg_dist_pick <- distCosine(pick_coord, la_guardia_coord)

train$lg_dist_drop <- distCosine(drop_coord, la_guardia_coord)


train <- train %>%

  mutate(speed = dist/trip_duration*3.6,

         date = date(pickup_datetime),

         month = month(pickup_datetime, label = TRUE),

         wday = wday(pickup_datetime, label = TRUE),

         wday = fct_relevel(wday, c("Mon", "Tues", "Wed", "Thurs", "Fri", "Sat", "Sun")),

         hour = hour(pickup_datetime),

         work = (hour %in% seq(8,18)) & (wday %in% c("Mon","Tues","Wed","Thurs","Fri")),

         jfk_trip = (jfk_dist_pick < 2e3) | (jfk_dist_drop < 2e3),

         lg_trip = (lg_dist_pick < 2e3) | (lg_dist_drop < 2e3),

         blizzard = !( (date < ymd("2016-01-22") | (date > ymd("2016-01-29"))) )

         )
行程距离
根据上、下车的坐标,我们能计算出这两点的直接距离。为此,我们使用geosphere包的distCosine函数实现,该函数计算球面上任何两点的距离。
set.seed(4321)

train %>%

  sample_n(5e4) %>%

  ggplot(aes(dist, trip_duration)) +

  geom_point() +

  scale_x_log10() +

  scale_y_log10() +

  labs(x = "Direct distance [m]", y = "Trip duration [s]")
-
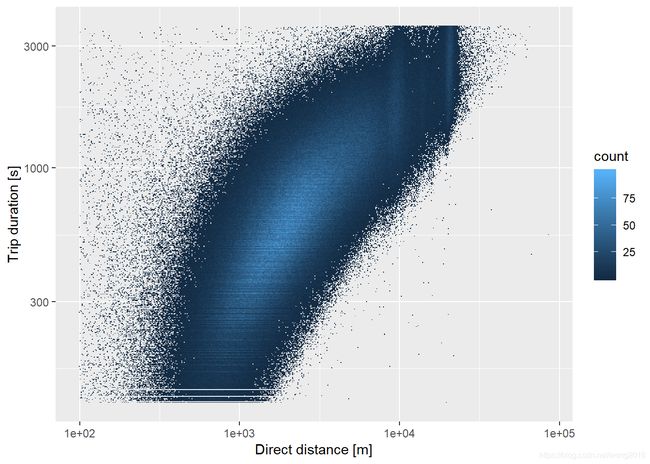
距离与时间大致呈正相关的关系。
-
有一些很短的距离,时间的分布范围却很广。
我们因此删除极端数据点,并将数据取对数变换,再作图比较。
train %>%

  filter(trip_duration < 3600 & trip_duration > 120) %>%

  filter(dist > 100 & dist < 100e3) %>%

  ggplot(aes(dist, trip_duration)) +

  geom_bin2d(bins = c(500,500)) +

  scale_x_log10() +

  scale_y_log10() +

  labs(x = "Direct distance [m]", y = "Trip duration [s]")
速度
通过计算平均的乘车速度,我们也可以删除极端值。虽然我们不能使用speed作为预测变量,因为它需要知道时间,而在检验集里没有。但是,它可以用在训练集里清洗数据。下面看一看训练集里speed的分布。
train %>%

  filter(speed > 2 & speed < 1e2) %>%

  ggplot(aes(speed)) +

  geom_histogram(fill = "red", bins = 50) +

  labs(x = "Average speed [km/h] (direct distance)")
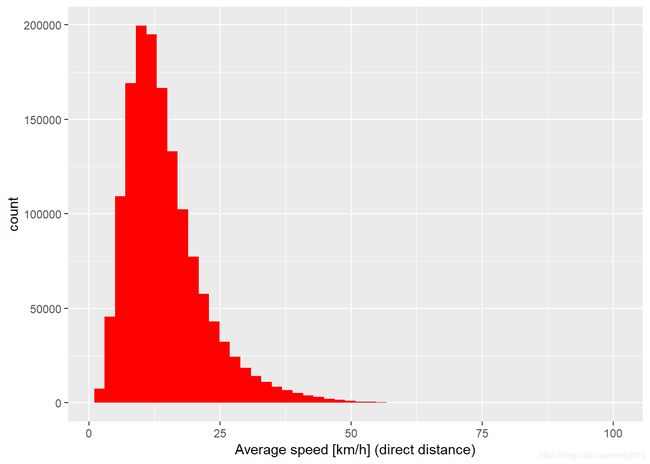
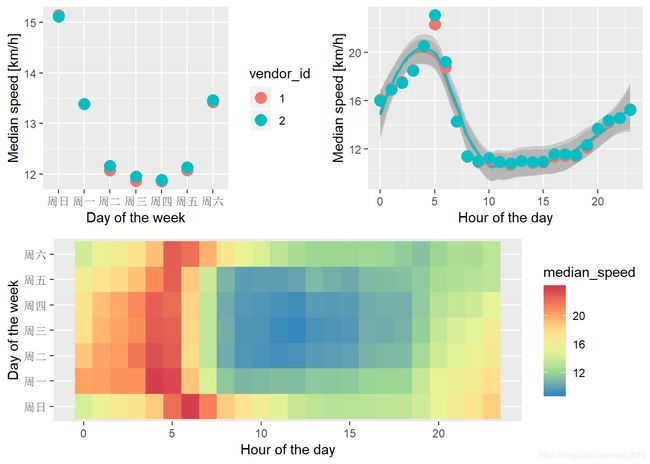
平均速度在15(km/h)比较合理,而超过50是不可思议的,可能是在高速公路上。类似地,我们也可以查看平均速度 per day and hour.
p1 <- train %>%

  group_by(wday, vendor_id) %>%

  summarise(median_speed = median(speed)) %>%

  ggplot(aes(wday, median_speed, color = vendor_id)) +

  geom_point(size = 4) +

  labs(x = "Day of the week", y = "Median speed [km/h]")


p2 <- train %>%

  group_by(hour, vendor_id) %>%

  summarise(median_speed = median(speed)) %>%

  ggplot(aes(hour, median_speed, color = vendor_id)) +

  geom_smooth(method = "loess", span = 1/2) +

  geom_point(size = 4) +

  labs(x = "Hour of the day", y = "Median speed [km/h]") +

  theme(legend.position = "none")


p3 <- train %>%

  group_by(wday, hour) %>%

  summarise(median_speed = median(speed)) %>%

  ggplot(aes(hour, wday, fill = median_speed)) +

  geom_tile() +

  labs(x = "Hour of the day", y = "Day of the week") +

  scale_fill_distiller(palette = "Spectral")


layout <- matrix(c(1,2,3,3),2,2,byrow=TRUE)

multiplot(p1, p2, p3, layout=layout)
-
出租车在周末和周一开的更快些。
-
早晨开的快,而从8am~6pm则开的慢。
-
两家公司差别不大。
-
热图提示我们在日和周的中部产生一个
low-speed-zone.


