Python数据可视化——Matplotlib可视化(一)
数据可视化,是关于数据视觉表现形式的科学技术研究。其中,这种数据的视觉表现形式被定义为,一种以某种概要形式抽提出来的信息,包括相应信息单位的各种属性和变量。
Python有很多非常优秀易用的数据可视化的库,作为入门在这里使用Python的matplotlib,事实上Python中很多可视化库都是基于matplotlib开发的。
Matplotlib是Python中最常用的可视化工具之一,可以非常方便地创建海量类型地2D图表和一些基本的3D图表,可根据数据集(DataFrame,Series)自行定义x,y轴,绘制图形(线形图,柱状图,直方图,密度图,散布图等等),能够解决大部分的需要。Matplotlib中最基础的模块是pyplot。
Matplotlib基本绘图流程:
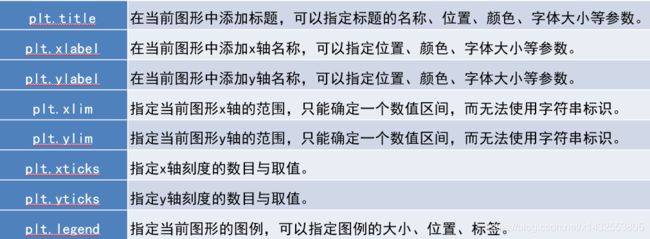
基本函数:
绘制散点图:
import numpy as np
import matplotlib.pyplot as plt

x = np.linspace(0,2*np.pi,100)
y = np.sin(x) + np.random.rand(100)

plt.figure(figsize=(10,5))
plt.title('sin散点图')
plt.scatter(x,y)
plt.show()
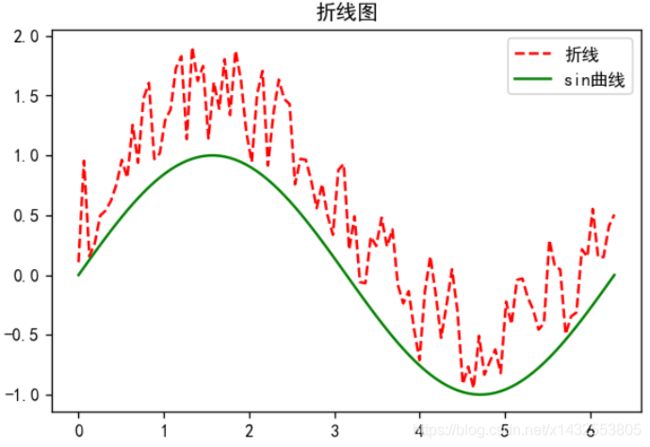
绘制折线图:
x = np.linspace(0,2*np.pi,100)
y = np.sin(x) + np.random.rand(100)

plt.figure(dpi=120)  # dpi为像素
plt.title('折线图')
plt.plot(x,y,'r--')
plt.plot(x,np.sin(x),'g')
plt.legend(['折线','sin曲线'])
plt.show()
绘制直方图:
x = range(10)
np.random.seed(123)
y1 = np.random.random(10)
y2 = np.random.random(10)

plt.bar(x,y1,facecolor='r')
plt.bar(x,-y2,facecolor='g')
for i,j in zip(x,y1):     # zip() 打包为元祖的列表
    plt.text(i,j+0.05,'%.2f'%j,ha='center',va='bottom')
for i,j in zip(x,y2):
    plt.text(i,-j-0.02,'%.2f'%j,ha='center',va='top')

plt.title(r'$\sigma_i=15$')  # 可写方程表达式
plt.ylim(-1.2,1.2)
plt.show()
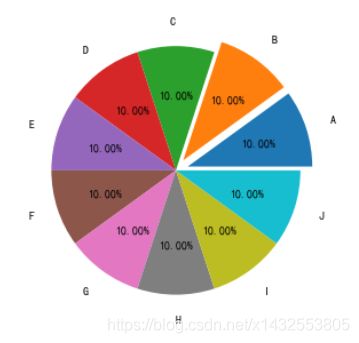
饼图:
z = np.ones(10)

plt.figure(figsize=(5,5))
plt.pie(z,autopct='%.2f%%',explode=[0.1]*2+[0]*8,labels=list('ABCDEFGHIJ'),labeldistance=1.2)
plt.show()


