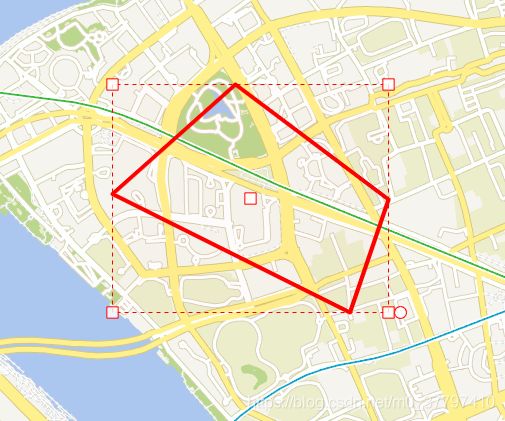
openlayers拖拽、旋转、缩放、拉伸变形 (十二)
gis应用中拖动旋转和缩放是编辑中比较常见的功能,在openlayers中拖拽可以通过ol.interaction.Translate来实现,但是其他功能没有,所以要用的openlayers的一个扩展ol-ext。
1. ol-ext
ol-ext是openlayers的扩展,他主要包含控件,交互,弹出窗口等功能。类似于WEB前端的UI框架。他是一个成熟的扩展,可以让你省去很多时间,避免很多问题。
注意区分一下使用方式对应的包名:
在webpack中使用
npm install ol-ext
在web中使用
npm install openlayers-ext
ol-ext官网链接
ol-ext在线示例
注意3.1.0版本之前某些功能会需要依赖jQuery。
2. 创建地图
const tileLayer = new Tile({
  source: new XYZ({
    url: `http://192.168.0.98:5000/tiles/world-base/{z}/{x}/{y}.png`,
  }),
})
const map = new Map({
  view: new View({
    center: transform([121.507291, 31.235963], 'EPSG:4326', 'EPSG:3857'),
    zoom: 15,
    maxZoom: 18,
    minZoom: 11,
  }),
  layers: [tileLayer],
  target: 'map'
})
this.map = map
3. 添加几何图形
const polygon = new Feature({
  geometry: new Polygon([
    [
      transform([121.501842, 31.239204], 'EPSG:4326', 'EPSG:3857'),
      transform([121.506337, 31.238305], 'EPSG:4326', 'EPSG:3857'),
      transform([121.506606, 31.235846], 'EPSG:4326', 'EPSG:3857'),
      transform([121.500243, 31.236103], 'EPSG:4326', 'EPSG:3857'),
    ]
  ]),
})
polygon.setStyle(new Style({
  stroke: new Stroke({
    width: 4,
    color: [255, 0, 0, 1],
  }),
}))
this.map.addLayer(new VectorLayer({
  source: new VectorSource({
    features: [polygon],
  }),
}))
4. 添加交互
关键代码在这,new一个ExtTransform对象,再通过map对象的addInteraction方法添加进去。
ExtTransform是ol-ext/interaction/Transform。
const transform = new ExtTransform({
  enableRotatedTransform: false,
  hitTolerance: 2,
  translate: true, // 拖拽
  stretch: false, // 拉伸
  scale: true, // 缩放
  rotate: true, // 旋转
  translateFeature: false,
  noFlip: true,
  // layers: [],
})
this.map.addInteraction(transform)
这里单独记一下配置中的layers,当你需要指定哪些矢量层才能编辑,那么在这里填入对应的矢量层对象就行。
layers: [ VectorLayer ]
VectorLayer是new ol/layer/Vector的对象。
5. 效果展示
6. 完整代码
<template>
  <div class="map" id="map"></div>
</template>

<script>
import { Map, View, Feature } from 'ol'
import { Tile, Vector as VectorLayer } from 'ol/layer'
import { XYZ, Vector as VectorSource } from 'ol/source'
import { Style, Stroke } from 'ol/style'
import { Polygon } from 'ol/geom'
import { transform } from 'ol/proj'
import ExtTransform from 'ol-ext/interaction/Transform'
export default {
  data() {
    return {
      map: null,
    }
  },
  computed: {},
  watch: {},
  beforeCreate() {},
  created() {},
  beforeMount() {},
  mounted() {
    this.createMap()
    this.createPolygon()
    this.onEdit()
  },
  activated() {},
  deactivated() {},
  beforeUpdate() {},
  updated() {},
  beforeDestroy() {},
  methods: {
    createMap() {
      const tileLayer = new Tile({
        source: new XYZ({
          url: `http://192.168.0.98:5000/tiles/world-base/{z}/{x}/{y}.png`,
        }),
      })
      const map = new Map({
        view: new View({
          center: transform([121.507291, 31.235963], 'EPSG:4326', 'EPSG:3857'),
          zoom: 15,
          maxZoom: 18,
          minZoom: 11,
        }),
        layers: [tileLayer],
        target: 'map'
      })
      this.map = map
    },
    createPolygon() {
      const polygon = new Feature({
        geometry: new Polygon([
          [
            transform([121.501842, 31.239204], 'EPSG:4326', 'EPSG:3857'),
            transform([121.506337, 31.238305], 'EPSG:4326', 'EPSG:3857'),
            transform([121.506606, 31.235846], 'EPSG:4326', 'EPSG:3857'),
            transform([121.500243, 31.236103], 'EPSG:4326', 'EPSG:3857'),
          ]
        ]),
      })
      polygon.setStyle(new Style({
        stroke: new Stroke({
          width: 4,
          color: [255, 0, 0, 1],
        }),
      }))
      this.map.addLayer(new VectorLayer({
        source: new VectorSource({
          features: [polygon],
        }),
      }))
    },
    onEdit() {
      const transform = new ExtTransform({
        enableRotatedTransform: false,
        hitTolerance: 2,
        translate: true, // 拖拽
        stretch: false, // 拉伸
        scale: true, // 缩放
        rotate: true, // 旋转
        translateFeature: false,
        noFlip: true,
        // layers: [],
      })
      this.map.addInteraction(transform)
    }
  }
}
</script>

<style lang="scss" scoped>
  .map{ width: 100%; height: 100vh; }
</style>
7. 补充
通过上面例子的思路,除了几何图形的编辑,同样图片,canvas,svg一样也可以,等有空再来补充demo。
