Openlayers3 实现点击不同的图标弹出不同的popup信息
1、
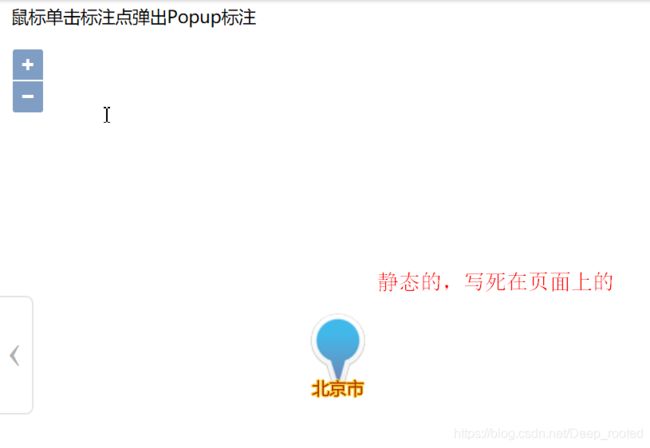
我们老师的书籍《WebGIS之Openlayers全面解析》上面有关于popup的例子,作为例子,肯定是写死的,没有查询数据库,也就是只有一个地理位置。(先不要管为什么看不到地图 )如下图:

2、
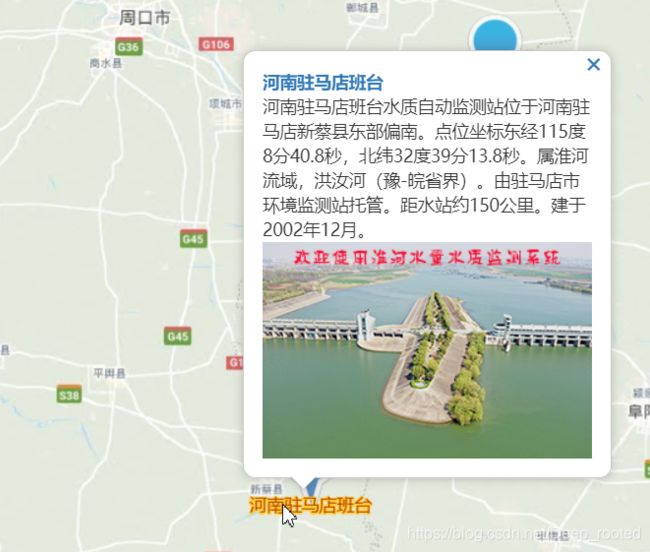
我想要的效果就是,查询数据库,找出所有的监测站点,并把这些站点显示在地图上,点击不同的站点能弹出不同的信息。如下图,是我想要的效果:
3、
先给出书本上参考例子的代码,接下来对例子的代码进行修改,达到我想要的效果。(要想看到地图,更换另一种地图即可,MapQuest地图不能用)
<html xmlns="http://www.w3.org/1999/xhtml">
<head>
    <title>添加Popup标注</title>
    <link href="../../libs/ol/ol.css" rel="stylesheet" type="text/css" />
    <script src="../../libs/ol/ol.js" type="text/javascript"></script>
<!--    <script src="../../libs/ol/ol-debug.js" type="text/javascript"></script>-->
    <!--  引入第三方插件库 -->
    <script src="../../libs/jquery-1.11.2.min.js" type="text/javascript"></script>
    <style type="text/css">
        body,html{
            border:none;padding:0;margin:0;
        }
        #menu{
            width:100%;
            height:20px;
            padding:5px 10px;
            font-size:14px;
            font-family:"微软雅黑";
            left:10px;
        }
        #map{
            width:100%;
            height:570px;
            position: relative;
        }
        .ol-popup {
          position: absolute;
          background-color: white;
          -webkit-filter: drop-shadow(0 1px 4px rgba(0,0,0,0.2));
          filter: drop-shadow(0 1px 4px rgba(0,0,0,0.2));
          padding: 15px;
          border-radius: 10px;
          border: 1px solid #cccccc;
          bottom: 12px;
          left: -50px;
        }
        .ol-popup:after, .ol-popup:before {
          top: 100%;
          border: solid transparent;
          content: " ";
          height: 0;
          width: 0;
          position: absolute;
          pointer-events: none;
        }
        .ol-popup:after {
          border-top-color: white;
          border-width: 10px;
          left: 48px;
          margin-left: -10px;
        }
        .ol-popup:before {
          border-top-color: #cccccc;
          border-width: 11px;
          left: 48px;
          margin-left: -11px;
        }
        .ol-popup-closer {
          text-decoration: none;
          position: absolute;
          top: 2px;
          right: 8px;
        }
        .ol-popup-closer:after {
          content: "✖";
        }
        #popup-content{
            font-size:14px;
            font-family:"微软雅黑";
        }
        #popup-content .markerInfo {
            font-weight:bold;
        }
    </style>
</head>
<body>
    <div id="menu">
        鼠标单击标注点弹出Popup标注
    </div>
    <div id="map" >
        <!-- Popup -->
        <div id="popup" class="ol-popup" >
              <a href="#" id="popup-closer" class="ol-popup-closer"></a>
              <div id="popup-content">
              </div>
        </div>
    </div>
    <script type="text/javascript">
        var beijing = ol.proj.fromLonLat([116.28, 39.54]);
        //示例标注点北京市的信息对象
        var featuerInfo = {
            geo: beijing,
            att: {
                title: "北京市(中华人民共和国首都)", //标注信息的标题内容
                titleURL: "http://www.openlayers.org/", //标注详细信息链接
                text: "北京(Beijing),简称京,中华人民共和国首都、直辖市,中国的政治、文化和国际交往中心……", //标注内容简介
                imgURL: "../../images/label/bj.png" //标注的图片
            }
        }

        /**
        * 实例化Map对象加载地图,默认底图加载MapQuest地图
        */
        var map = new ol.Map({
            layers: [
                new ol.layer.Tile({
                    source: new ol.source.MapQuest({ layer: 'osm' })
                })
              ],
            target: 'map',
            view: new ol.View({
                center: beijing,
                zoom: 3
            })
        });

        /**
        * 创建标注样式函数,设置image为图标ol.style.Icon
        * @param {ol.Feature} feature 要素
        */
        var createLabelStyle = function (feature) {
            return new ol.style.Style({
                image: new ol.style.Icon(/** @type {olx.style.IconOptions} */({
                    anchor: [0.5, 60],
                    anchorOrigin: 'top-right',
                    anchorXUnits: 'fraction',
                    anchorYUnits: 'pixels',
                    offsetOrigin: 'top-right',
                    // offset:[0,10],
                    // scale:0.5,  //图标缩放比例
                    opacity: 0.75,  //透明度
                    src: '../../images/label/blueIcon.png' //图标的url
                })),
                text: new ol.style.Text({
                    textAlign: 'center', //位置
                    textBaseline: 'middle', //基准线
                    font: 'normal 14px 微软雅黑',  //文字样式
                    text: feature.get('name'),  //文本内容
                    fill: new ol.style.Fill({ color: '#aa3300' }), //文本填充样式(即文字颜色)
                    stroke: new ol.style.Stroke({ color: '#ffcc33', width: 2 })
                })
            });
        }

        //实例化Vector要素,通过矢量图层添加到地图容器中
        var iconFeature = new ol.Feature({
            geometry: new ol.geom.Point(beijing),
            name: '北京市',  //名称属性
            population: 2115 //大概人口数(万)
        });
        iconFeature.setStyle(createLabelStyle(iconFeature));
        //矢量标注的数据源
        var vectorSource = new ol.source.Vector({
            features: [iconFeature]
        });
        //矢量标注图层
        var vectorLayer = new ol.layer.Vector({
            source: vectorSource
        });
        map.addLayer(vectorLayer);

        /**
        * 实现popup的html元素
        */
        var container = document.getElementById('popup');
        var content = document.getElementById('popup-content');
        var closer = document.getElementById('popup-closer');

        /**
        * 在地图容器中创建一个Overlay
        */
        var popup = new ol.Overlay(/** @type {olx.OverlayOptions} */({
            element: container,
            autoPan: true,
            positioning: 'bottom-center',
            stopEvent: false,
            autoPanAnimation: {
                duration: 250
            }
        }));
        map.addOverlay(popup);

        /**
        * 添加关闭按钮的单击事件(隐藏popup)
        * @return {boolean} Don't follow the href.
        */
        closer.onclick = function () {
            popup.setPosition(undefined);  //未定义popup位置
            closer.blur(); //失去焦点
            return false;
        };

        /**
        * 动态创建popup的具体内容
        * @param {string} title
        */
        function addFeatrueInfo(info) {
            //新增a元素
            var elementA = document.createElement('a');
            elementA.className = "markerInfo";
            elementA.href = info.att.titleURL;
            //elementA.innerText = info.att.title;
            setInnerText(elementA, info.att.title);
            content.appendChild(elementA); // 新建的div元素添加a子节点
            //新增div元素
            var elementDiv = document.createElement('div');
            elementDiv.className = "markerText";
            //elementDiv.innerText = info.att.text;
            setInnerText(elementDiv, info.att.text);
            content.appendChild(elementDiv); // 为content添加div子节点
            //新增img元素
            var elementImg = document.createElement('img');
            elementImg.className = "markerImg";
            elementImg.src = info.att.imgURL;
            content.appendChild(elementImg); // 为content添加img子节点
        }
        /**
        * 动态设置元素文本内容(兼容)
        */
        function setInnerText(element, text) {
            if (typeof element.textContent == "string") {
                element.textContent = text;
            } else {
                element.innerText = text;
            }
        }

        /**
        * 为map添加点击事件监听,渲染弹出popup
        */
        map.on('click', function (evt) {
            var coordinate = evt.coordinate;
            //判断当前单击处是否有要素,捕获到要素时弹出popup
            var feature = map.forEachFeatureAtPixel(evt.pixel, function (feature, layer) { return feature; });
            if (feature) {
                content.innerHTML = ''; //清空popup的内容容器
                addFeatrueInfo(featuerInfo); //在popup中加载当前要素的具体信息
                if (popup.getPosition() == undefined) {
                    popup.setPosition(coordinate); //设置popup的位置
                }
            }
        });
        /**
        * 为map添加鼠标移动事件监听,当指向标注时改变鼠标光标状态
        */
        map.on('pointermove', function (e) {
            var pixel = map.getEventPixel(e.originalEvent);
            var hit = map.hasFeatureAtPixel(pixel);
            map.getTargetElement().style.cursor = hit ? 'pointer' : '';
        });
    </script>
</body>
</html>
4、
- 想要达到动态效果,上面的地方有两处需要修改,
先找到下面的代码块
 //实例化Vector要素,通过矢量图层添加到地图容器中
    var iconFeature = new ol.Feature({
        geometry: new ol.geom.Point(beijing),
        name: '北京市',  //名称属性
        population: 2115 //大概人口数(万)
    });
    iconFeature.setStyle(createLabelStyle(iconFeature));
    //矢量标注的数据源
    var vectorSource = new ol.source.Vector({
        features: [iconFeature]
    });
- 然后在后面追加如下代码:
$.post("../FindAlllStationServlet",function (data)
    {
        for(var i=0;i<data.length;i++)
        {
            var obj=data[i];
            var longitude=obj.longitude;
            var latitude=obj.latitude;
            var stationName=obj.stationName;

            //实例化Vector要素,通过矢量图层添加到地图容器中
            var iconFeature2 = new ol.Feature({
                geometry: new ol.geom.Point(ol.proj.fromLonLat([longitude,latitude])),
                name: stationName,  //名称属性
                population: 2115 //大概人口数(万)
            });
            iconFeature2.setStyle(createLabelStyle(iconFeature2));
            //矢量标注的数据源
            vectorSource.addFeature(iconFeature2)

        }

    });
代码说明:向服务器发送Ajax请求,服务器响应回来许多个站点的数据,站点表如下:

用一个for循环,遍历一个站点对象数组,把这些监测站点全部显示在地图上。
还有一处的代码需要修改
先找到为地图绑定单击事件的代码
 /**
     * 为map添加点击事件监听,渲染弹出popup
     */
    map.on('click', function (evt) {
把这个单击事件修改成如下样子:
 map.on('click', function (evt) {
        var coordinate = evt.coordinate;
        var zuobiao4326=ol.proj.transform(coordinate, 'EPSG:3857' ,'EPSG:4326');
        var jingdu=zuobiao4326[0];
        var weidu=zuobiao4326[1];
        var zuobiao=jingdu+","+weidu;
        //判断当前单击处是否有要素,捕获到要素时弹出popup
        var feature = map.forEachFeatureAtPixel(evt.pixel, function (feature, layer) { return feature; });
        if (feature)
        {

            $.post("../FindSimIntroServlet",{zuobiao:zuobiao},function (data)
            {
                var introduction=data.introduction;
                var stationName=data.stationName;
                featuerInfo.att.text=introduction;//正文
                featuerInfo.att.title=stationName;//标题


                content.innerHTML = ''; //清空popup的内容容器
                addFeatrueInfo(featuerInfo); //在popup中加载当前要素的具体信息
                if (popup.getPosition() == undefined)
                {
                    popup.setPosition(coordinate); //设置popup的位置
                }
            });
        }
    });
代码说明:获取鼠标点击位置的经纬度,然后把经纬度发送到后台,后台拿到了经纬度的信息后,根据经纬度查询数据库,
我的SQL语句如下:
SELECT * FROM water_quality_station WHERE ABS(longitude-?)<0.1 AND ABS(latitude-?)<0.1;
SQL语句的含义:abs()是求绝对值的函数,这条语句就是找出与给定位置经度之差小于0.1,并且纬度之差小于0.1的监测站。
这里是有个小小的问题,假如两个监测站黏在一块的话(当然事实上不存在这种监测站),那么查出来的就是两条记录,我们只能选择其中的一条记录发送给前端了。用户这时可能会抱怨:我明明点击的是A监测站,你为什么给我显示B监测站的信息?
误差范围我选择的是0.1,经过测试,这个值不能取得太大,也不能取得太小。太大的话,就会查出很多的记录;太小的话一条都查不到,也就是用户明明点击了图标,却没有弹出相应的信息。
5、测试效果
先点击河南驻马店班台:

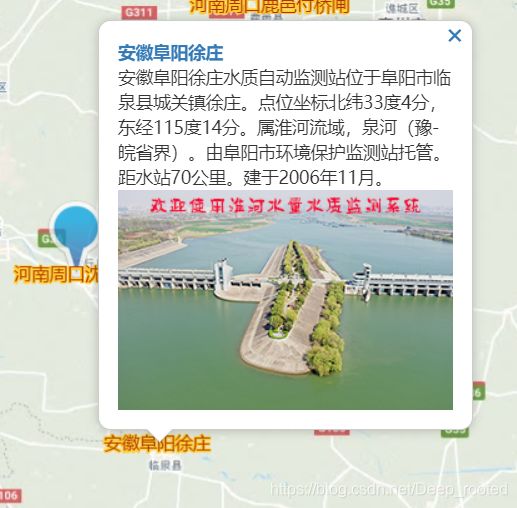
在点击安徽阜阳徐庄:

已经实现了点击不同图标弹出不同信息的效果。实际上点击一次图标就会向后台发送一次请求。
总结
- 想要实现点击不同popup弹出不同信息的效果,只需修改书本例子中的两处代码。
- 实现的原理就是获取鼠标点击处的经纬度,然后把经纬度发送到后台。后台根据经纬度,返回一个监测站对象。