OpenLayers 5 使用GeoJSON数据渲染热力图
GIS开发中会遇到需要使用热力图Heatmap的时候,openlayers5官方示例给出的是kml文件描述的热力图数据,开发中接触更多的还是GeoJSON格式,本文就使用GeoJSON格式来实现一个热力图。
一、实现思路
https://openlayers.org/en/latest/examples/heatmap-earthquakes.html
官方例子是从一个kml文件解析出生成的热力图,那么我们先分析一下生成一个热力图需要哪些数据:
- 地点
- 坐标
- 震级
基本上我们有了这三个数据就可以描述一个地点的地震情况了。
接下来我们看一下官方例子里使用了哪些技术,核心代码:
//前面省略了import语句等,详见官方的Demo
    var vector = new HeatmapLayer({
        source: new VectorSource({
          url: 'data/kml/2012_Earthquakes_Mag5.kml',
          format: new KML({
            extractStyles: false
          })
        }),
        blur: parseInt(blur.value, 10),
        radius: parseInt(radius.value, 10)
      });

      vector.getSource().on('addfeature', function(event) {
           var name = event.feature.get('name');
        var magnitude = parseFloat(name.substr(2));
        event.feature.set('weight', magnitude - 5);
      });
openlayers5有一个 ol/layer/heatmap 类,用来渲染热力图,那么稍微研究一下初始化该类型对象的代码:
 var vector = new HeatmapLayer({
        source: new VectorSource({
          url: 'data/kml/2012_Earthquakes_Mag5.kml',
          //实际上我们只需要把这里的source对象换成GeoJSON对象就可以使用GeoJSON描述的数据源了
            format: new KML({
            extractStyles: false
          })
        }),
        blur: parseInt(blur.value, 10),
        radius: parseInt(radius.value, 10)
      });
可以看到初始化source的时候,format初始化为一个KML对象,那么我们一会试试把它换成GeoJSON对象。
下面一段代码是在这个热力图图层添加要素的时候触发的addfeatrue事件上面绑定一个回调函数,是做什么的呢?我们先看一下kml文件,重点关注Placemark字段:
<Placemark id="2012 Jan 15 13:40:16.40 UTC">
                <name>M 5.9 - 2012 Jan 15, SOUTH SHETLAND ISLANDSname>
                <magnitude>5.9magnitude>
                <Point>
                    <coordinates>-56.072,-60.975,0coordinates>
                Point>
            Placemark>
然后对照回调函数的代码看一下:
  vector.getSource().on('addfeature', function(event) {
          //从name字段取得字符串: M 5.9 - 2012 Jan 15, SOUTH SHETLAND ISLANDS
           var name = event.feature.get('name');
        //从子串中取得浮点数:5.9
        var magnitude = parseFloat(name.substr(2));
        //设定feature的权重weight为:5.9-5=0.9
        event.feature.set('weight', magnitude - 5);
      });
分析完这一段代码之后,我们就可以自己动手了。
二、实现步骤
首先我们得搞一些GeoJSON描述的地震数据:
https://earthquake.usgs.gov/earthquakes/feed/v1.0/summary/all_month.geojson
为了调试方便我下载到了本地保存为earthquake.json。
首先改造heatmap初始化过程:
  let heatMapLayer = new HeatmapLayer({
    source: new VectorSource({
      //我们使用json数据
      url: './earthquake.json',
      format: new GeoJSON()
    }),
    //这里可以根据自己项目的实际,绑定页面的控件动态调整
    blur: 5,
    radius: 5
  });
然后我们看一下GeoJSON格式,每一个地震点的信息就是这样来表示的:
{
            "type": "Feature",
            "properties": {
                "mag": 1.36,
                "place": "6km W of Cobb, CA",
                "time": 1554968762010,
                "updated": 1554969663578,
                "tz": -480,
                "url": "https://earthquake.usgs.gov/earthquakes/eventpage/nc73163930",
                "detail": "https://earthquake.usgs.gov/earthquakes/feed/v1.0/detail/nc73163930.geojson",
                "felt": null,
                "cdi": null,
                "mmi": null,
                "alert": null,
                "status": "automatic",
                "tsunami": 0,
                "sig": 28,
                "net": "nc",
                "code": "73163930",
                "ids": ",nc73163930,",
                "sources": ",nc,",
                "types": ",geoserve,nearby-cities,origin,phase-data,scitech-link,",
                "nst": 25,
                "dmin": 0.01216,
                "rms": 0.04,
                "gap": 32,
                "magType": "md",
                "type": "earthquake",
                "title": "M 1.4 - 6km W of Cobb, CA"
            },
            "geometry": {
                "type": "Point",
                "coordinates": [-122.7946701, 38.8251648, 2.4]
            },
            "id": "nc73163930"
        },
……
显而易见,mag字段就是地震的震级,是我们需要的,place是发生的地点,geometry的信息就是这个feature的形态。
- 地点√
- 坐标√
- 震级√
似乎万事俱备了。
最后我们需要实现的就是回调函数:
 heatMapLayer.getSource().on('addfeature', function(event) {
    var place = event.feature.get('place');
    var magnitude = event.feature.get('mag');
    //设定权重减去的数字是为了过滤地震等级,比如只想显示3级以上地震,那就减去3
    event.feature.set('weight', magnitude-3);
  });
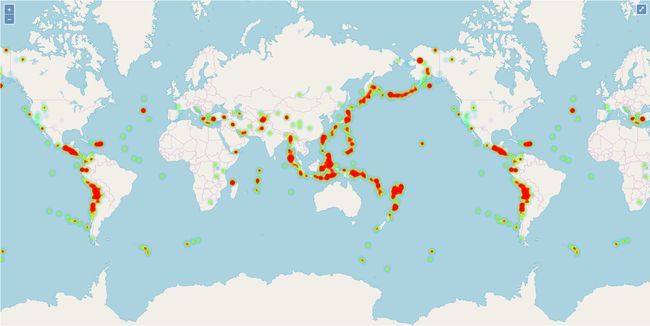
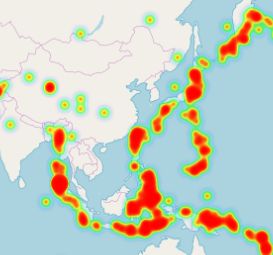
效果图: