openlayers6【十七】vue VectorLayer矢量图层画地图省市区,多省市区(粤港澳大湾区)效果详解
文章目录
- 1. VectorLayer矢量图层的理解
- 2. openlayers通过坐标点画中国地图
- 2.1 准备边界的 data 数据
- 2.2 准备 china.json 的数据文件
- 2.3 实现区域描边方法详解
- 2.4 完整代码
- 4. 画省,市,区的边界效果
- 4.1 如:四川省(下载对应的geo json数据)
- 4.2 如:成都市,金牛区(下载对应的geo json数据)
- 5. 画多省市区(粤港澳大湾区)效果
1. VectorLayer矢量图层的理解
在我们做什么事情之前,如果想完全搞懂某一样东西 预先善其事必先利其器 ,先搞定其原理之后,在去实现他就会非常简单了,而且下次也会牢记于心。好了,下面我们就开始吧!
在openlayers实际项目中,我们经常会遇到这种需求,通过已知道的一些经纬度坐标点位数据在地图上想要得到一块区域,并把他已更显眼的方式呈现出来。如下图所示效果。

要想实现下面效果,我们是用的是VectorLayer矢量图层去实现,就像在底图上添加一个图层效果。如下图所示

只是我们现在添加的只有一层,在openlayers中,可以添加多个图层信息,会根据你添加图层的顺序一层一层叠加在地图中。
VectorLayer矢量图层: 矢量图层是在客户端渲染的,在 web 环境中,对应的就是浏览器。构成一个矢量图层的包含一个数据(source)和一个样式(style),数据构成矢量图层的要素,样式规定要素显示的方式和外观。一个初始化成功的矢量图层包含一个到多个要素(feature),每个要素由地理属(geometry)和多个其他的属性,可能包含名称等。
更多图层的理解可以访问 openlayers 6【四】地图图层Layers详解 了解更多。
好了,说完矢量图层的简单的理论东西,我们下面来实现画一个中国地图的图层效果。
2. openlayers通过坐标点画中国地图
上面提到,图层包含数据(source)和一个样式(style),现在我们先准备渲染一块区域的数据源。
2.1 准备边界的 data 数据
给大家推荐一个geoJson提供边界数据的网址:geo数据源,大家可以在上面选择需要的区域的边界,下载json数据。

2.2 准备 china.json 的数据文件
红色框中是 geo数据源 中国的边界数据

2.3 实现区域描边方法详解
一个初始化成功的矢量图层包含一个到多个要素(feature),每个要素由地理属(geometry)和多个其他的属性,可能包含名称等
2.3.1 addArea()方法详解:
- 我们先创建一个featureSource 要素的数组和每个要素的areaFeature
- 实例化一个矢量图层 VectorLayer,命名为
areaLayer - 把图层添加到map地图中,此时图层暂时没有数据
- 遍历上面准备的geo json数据源数据,通过
new MultiPolygon和new Polygon的方式去解析 json数据源 geometry (类型,一般的地图边界可能会存在两种格式),如果是MultiPolygon则使用new MultiPolygo去解析,如果是 Polygon则使用new Polygon去解析json数据,把解析的数据返回到一个参数 areaFeature要素中。 - 通过
setStyle去设置图层的样式信息,这里只设置了填充和描边样式 - 把要素添信息添加到
areaFeature图层的数据源中
2.3.2 addArea() 方法完整代码:
/**
 * 设置区域
 */
addArea(geo = []) {
    if (geo.length == 0) return false;
    let areaFeature = null;
    // 设置图层
    this.c = new VectorLayer({
        source: new VectorSource({
            features: []
        })
    });
    // 添加图层
    this.map.addLayer(this.areaLayer);
    geo.forEach(g => {
        let lineData = g.features[0];
        if (lineData.geometry.type == "MultiPolygon") {
            areaFeature = new Feature({
                geometry: new MultiPolygon(
                    lineData.geometry.coordinates
                ).transform("EPSG:4326", "EPSG:3857")
            });
        } else if (lineData.geometry.type == "Polygon") {
            areaFeature = new Feature({
                geometry: new Polygon(
                    lineData.geometry.coordinates
                ).transform("EPSG:4326", "EPSG:3857")
            });
        }
    });
    areaFeature.setStyle(
        new Style({
            fill: new Fill({ color: "#4e98f444" }),
            stroke: new Stroke({
                width: 3,
                color: [71, 137, 227, 1]
            })
        })
    );
    this.areaLayer.getSource().addFeatures([areaFeature]);
},
2.4 完整代码
<template>
    <div id="app">
        <div id="Map" ref="map">div>
    div>
template>
<script>
import "ol/ol.css";
import TileLayer from "ol/layer/Tile";
import VectorLayer from "ol/layer/Vector";
import VectorSource from "ol/source/Vector";
import XYZ from "ol/source/XYZ";
import { Map, View, Feature, ol } from "ol";
import { Style, Stroke, Fill } from "ol/style";
import { Polygon, MultiPolygon } from "ol/geom";
import { defaults as defaultControls, OverviewMap } from "ol/control";
import { fromLonLat } from "ol/proj";

import areaGeo from "@/geoJson/china.json";
export default {
    data() {
        return {
            map: null,
            areaLayer: null
        };
    },
    methods: {
        /**
         * 初始化地图
         */
        initMap() {
            this.map = new Map({
                target: "Map",
                controls: defaultControls({
                    zoom: true
                }).extend([]),
                layers: [
                    new TileLayer(
                        {
                            source: new XYZ({
                                url:
                                    "http://map.geoq.cn/ArcGIS/rest/services/ChinaOnlineStreetPurplishBlue/MapServer/tile/{z}/{y}/{x}"
                            })
                        },
                        { zoomOffset: 1 }
                    )
                ],
                view: new View({
                    center: fromLonLat([108.522097, 37.272848]),
                    zoom: 4.7,
                    maxZoom: 19,
                    minZoom: 4
                })
            });
        },
                /**
         * 设置区域
         */
        addArea(geo = []) {
            if (geo.length == 0) return false;
            let areaFeature = null;
            // 设置图层
            this.areaLayer = new VectorLayer({
                source: new VectorSource({
                    features: []
                })
            });
            // 添加图层
            this.map.addLayer(this.areaLayer);
            geo.forEach(g => {
                let lineData = g.features[0];
                if (lineData.geometry.type == "MultiPolygon") {
                    areaFeature = new Feature({
                        geometry: new MultiPolygon(
                            lineData.geometry.coordinates
                        ).transform("EPSG:4326", "EPSG:3857")
                    });
                } else if (lineData.geometry.type == "Polygon") {
                    areaFeature = new Feature({
                        geometry: new Polygon(
                            lineData.geometry.coordinates
                        ).transform("EPSG:4326", "EPSG:3857")
                    });
                }
            });
            areaFeature.setStyle(
                new Style({
                    fill: new Fill({ color: "#4e98f444" }),
                    stroke: new Stroke({
                        width: 3,
                        color: [71, 137, 227, 1]
                    })
                })
            );
            this.areaLayer.getSource().addFeatures([areaFeature]);
        },
    },
    mounted() {
        this.ini	tMap();//初始化地图方法
        this.addArea(areaGeo);//添加区域图层方法
    }
};
script>
<style lang="scss" scoped>
// 此处非核心内容,已删除
style>
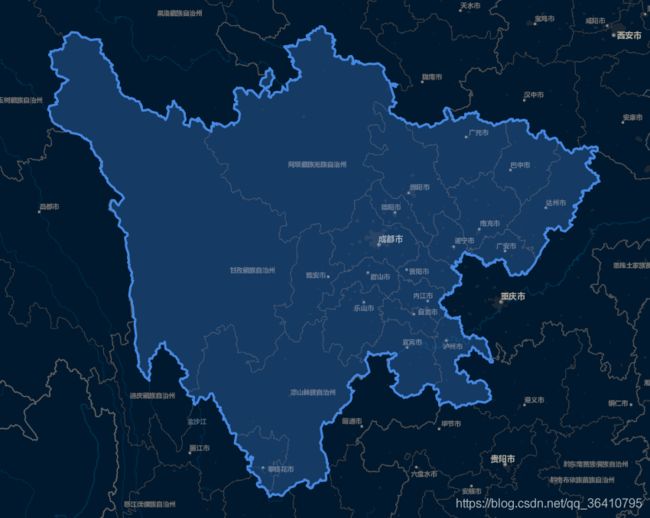
4. 画省,市,区的边界效果
道理一样,只需要换成对应的 geo边界数据文件即可
4.1 如:四川省(下载对应的geo json数据)
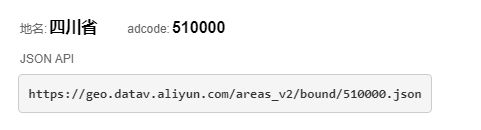
import areaGeo from "@/geoJson/sichuan.json";
4.2 如:成都市,金牛区(下载对应的geo json数据)

import areaGeo from "@/geoJson/chengdu.json";
import areaGeo from "@/geoJson/jinniu.json";

5. 画多省市区(粤港澳大湾区)效果
5.1 如:粤港澳大湾区项目需要如下展示效果,把下载的多个geo数据源的文件放在一个json里面,用逗号隔开。
9area.json 数据文件截图。(分别下载的是粤港澳范围的9块区域数据geoJson数据)
import areaGeo from "@/geoJson/9area.json";
