【特征工程】卡方分箱原理和python代码(附带训练数据和测试结果),适合二分类和多分类
背景介绍
本文针对有一定基础的数据分析人员,专门想了解卡方分箱原理和寻找能直接运行的代码的人员。
分箱是特征工程中常见的操作,也就是将某一个变量划分为多个区间,比如对年龄分箱,1-10岁,10-40岁,40+岁。卡方分箱就是用来寻找最优分割点的方法。
本文介绍了卡方分箱原理、python代码、使用数据集(有数据集构造代码)测试分箱效果几个部分。
注:这里保证代码肯定可以直接运行,并附上了检验分箱原理的代码。如果有注释不清楚的,欢迎一起讨论。
卡方分箱原理
卡方分箱是自底向上的(即基于合并的)数据离散化方法。它依赖于卡方检验:具有最小卡方值的相邻区间合并在一起,直到满足确定的停止准则。
基本思想:对于精确的离散化,相对类频率在一个区间内应当完全一致。因此,如果两个相邻的区间具有非常类似的类分布,则这两个区间可以合并;否则,它们应当保持分开。而低卡方值表明它们具有相似的类分布。
卡方检验可以用来评估两个分布的相似性,因此可以将这个特性用到数据分箱的过程中。
理想的分箱是在同一个区间内标签的分布是相同的。卡方分箱就是不断的计算相邻区间的卡方值(卡方值越小表示分布越相似),将分布相似的区间(卡方值最小的)进行合并,直到相邻区间的分布不同,达到一个理想的分箱结果。
下面用一个例子来解释:

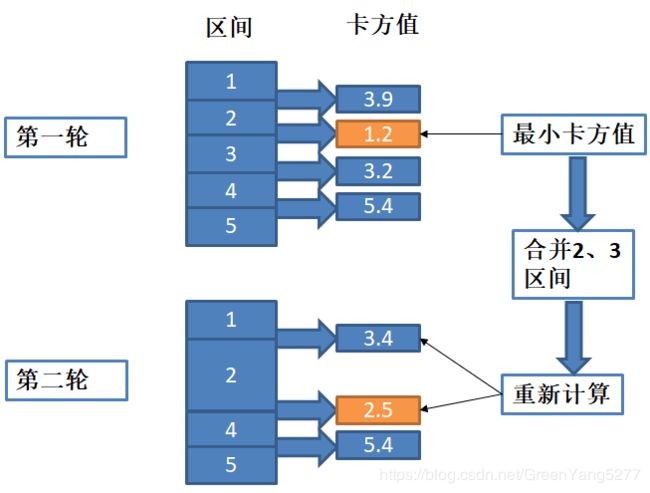
由上图,第一轮中初始化是5个区间,分别计算相邻区间的卡方值。找到1.2是最小的,合并2、3区间,为了方便,将合并后的记为第2区间,因此得到4个区间。第二轮中,由于合并了区间,影响该区间与前面的和后面的区间的卡方值,因此重新计算1和2,2和4的卡方值,由于4和5区间没有影响,因此不需要重新计算,这样就得到了新的卡方值列表,找到最小的取值2.5,因此该轮会合并2、4区间,并重复这样的步骤,一直到满足终止条件。
终止条件一般有两个,后面我的代码里的pvalue,smallest,biggest都是终止条件:
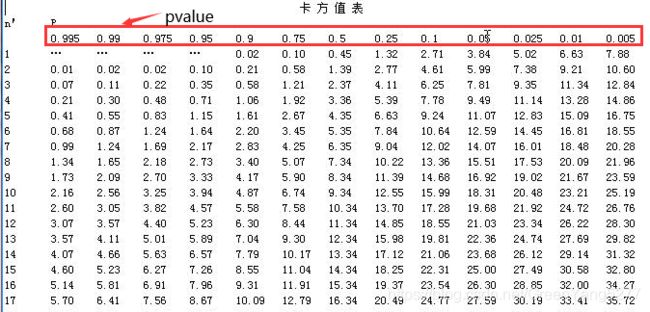
- 卡方值,设置相邻区间的最小卡方值。这里需要提到一点,计算出卡方值需要查询卡方表,会得到一个置信度,即pvalue。我的程序使用的scipy中直接计算置信度的工具scipy.stats.chi2_contingency,直接计算pvalue,因此设置最小卡方值也就是设置最大pvalue。如果不清楚pvalue和卡方值关系的小伙伴请看一下卡方检验(我可能表述的不清楚,但欢迎找我讨论)。

如果着急的小伙伴看一下这张表。标红的是pvalue,下面的是卡方值。基本规律就是卡方值越大,pvalue越小。可以先这么记忆,然后事后再查一下两者原理上的关系。 - 分箱个数,一般会设置最大分箱数和最小分箱数。最大分箱数防止算法过早停止;最小分箱数防止算法无穷尽的合并,最后合并成一个区间。
另一个问题你可能问了,你直接把相邻区间的卡方值写上了,怎么算的呢?
我举一个例子,就那1,2区间来说

标签在每个区间的分布如下

然后使用卡方值计算公式就可以计算了,我就不写具体怎么算了,公式非常简单,毕竟大家过来应该都是想看一下代码能不能运行的,我别把大家的忍耐力给耗光了,不多说了,下面是代码。
python代码
def tagcount(series,tags):
    """
    统计该series中不同标签的数量,可以针对多分类
    series:只含有标签的series
    tags:为标签的列表,以实际为准,比如[0,1],[1,2,3]
    """
    result = []
    countseries = series.value_counts()
    for tag in tags:
        try:
            result.append(countseries[tag])
        except:
            result.append(0)
    return result


def ChiMerge3(df, num_split,tags=[1,2,3],pvalue_edge=0.1,biggest=10,smallest=3,sample=None):
    """
    df:只包含要分箱的参数列和标签两列
    num_split:初始化时划分的区间个数,适合数据量特别大的时候。
    tags:标签列表,二分类一般为[0,1]。以实际为准。
    pvalue_edge:pvalue的置信度值
    bin:最多箱的数目
    smallest:最少箱的数目
    sample:抽样的数目,适合数据量超级大的情况。可以使用抽样的数据进行分箱。百万以下不需要
    """
    import pandas as pd
    import numpy as np
    import scipy
    variable = df.columns[0]
    flag = df.columns[1]
#进行是否抽样操作
    if sample != None:
        df = df.sample(n=sample)
    else:
        df

#将原始序列初始化为num_split个区间,计算每个区间中每类别的数量,放置在一个矩阵中。方便后面计算pvalue值。
    percent = df[variable].quantile([1.0*i/num_split for i in range(num_split+1)],interpolation= "lower").drop_duplicates(keep="last").tolist()
    percent = percent[1:]
    np_regroup = []
    for i in range(len(percent)):
        if i == 0:
            tempdata = tagcount(df[df[variable]<=percent[i]][flag],tags)
            tempdata.insert(0,percent[i])
        elif i == len(percent)-1:
            tempdata = tagcount(df[df[variable]>percent[i-1]][flag],tags)
            tempdata.insert(0,percent[i])
        else:
            tempdata = tagcount(df[(df[variable]>percent[i-1])&(df[variable]<=percent[i])][flag],tags)
            tempdata.insert(0,percent[i])
        np_regroup.append(tempdata)
    np_regroup = pd.DataFrame(np_regroup)
    np_regroup = np.array(np_regroup)


#如果两个区间某一类的值都为0,就会报错。先将这类的区间合并,当做预处理吧
    i = 0
    while (i <= np_regroup.shape[0] - 2):
        check = 0
        for j in range(len(tags)):
            if np_regroup[i,j+1] ==0 and np_regroup[i+1,j+1]==0:
                check += 1
        """
        这个for循环是为了检查是否有某一个或多个标签在两个区间内都是0,如果是的话,就进行下面的合并。
        """
        if check>0:
            np_regroup[i,1:] = np_regroup[i,1:] + np_regroup[i+1,1:]
            np_regroup[i, 0] = np_regroup[i + 1, 0]
            np_regroup = np.delete(np_regroup, i + 1, 0)
            i = i - 1
        i = i + 1

#对相邻两个区间进行置信度计算
    chi_table = np.array([])
    for i in np.arange(np_regroup.shape[0] - 1):
        temparray = np_regroup[i:i+2,1:]
        pvalue = scipy.stats.chi2_contingency(temparray,correction=False)[1]
        chi_table = np.append(chi_table, pvalue)
    temp = max(chi_table)

#把pvalue最大的两个区间进行合并。注意的是,这里并没有合并一次就重新循环计算相邻区间的pvalue,而是只更新影响到的区间。
    while (1):
        #终止条件,可以根据自己的期望定制化
        if (len(chi_table) <= (biggest - 1) and temp <= pvalue_edge):
            break
        if len(chi_table)<smallest:
            break

        num = np.argwhere(chi_table==temp)
        for i in range(num.shape[0]-1,-1,-1):
            chi_min_index = num[i][0]
            np_regroup[chi_min_index, 1:] = np_regroup[chi_min_index, 1:] + np_regroup[chi_min_index + 1, 1:]
            np_regroup[chi_min_index, 0] = np_regroup[chi_min_index + 1, 0]
            np_regroup = np.delete(np_regroup, chi_min_index + 1, 0)

            #最大pvalue在最后两个区间的时候,只需要更新一个,删除最后一个。大家可以画图,很容易明白
            if (chi_min_index == np_regroup.shape[0] - 1):
                temparray = np_regroup[chi_min_index-1:chi_min_index+1,1:]
                chi_table[chi_min_index - 1] = scipy.stats.chi2_contingency(temparray,correction=False)[1]
                chi_table = np.delete(chi_table, chi_min_index, axis=0)

            #最大pvalue是最先两个区间的时候,只需要更新一个,删除第一个。
            elif (chi_min_index == 0):
                temparray = np_regroup[chi_min_index:chi_min_index+2,1:]
                chi_table[chi_min_index] = scipy.stats.chi2_contingency(temparray,correction=False)[1]
                chi_table = np.delete(chi_table, chi_min_index+1, axis=0)

            #最大pvalue在中间的时候,影响和前后区间的pvalue,需要更新两个值。
            else:
                # 计算合并后当前区间与前一个区间的pvalue替换
                temparray = np_regroup[chi_min_index-1:chi_min_index+1,1:]
                chi_table[chi_min_index - 1] = scipy.stats.chi2_contingency(temparray,correction=False)[1]
                # 计算合并后当前与后一个区间的pvalue替换
                temparray = np_regroup[chi_min_index:chi_min_index+2,1:]
                chi_table[chi_min_index] = scipy.stats.chi2_contingency(temparray,correction=False)[1]
                # 删除替换前的pvalue
                chi_table = np.delete(chi_table, chi_min_index + 1, axis=0)

        #更新当前最大的相邻区间的pvalue
        temp = max(chi_table)

    print("*"*40)
    print("最终相邻区间的pvalue值为:")
    print(chi_table)
    print("*"*40)

    #把结果保存成一个数据框。
    """
    可以根据自己的需求定制化。我保留两个结果。
    1. 显示分割区间,和该区间内不同标签的数量的表
    2. 为了方便pandas对该参数处理,把apply的具体命令打印出来。方便直接对数据集处理。
        serise.apply(lambda x:XXX)中XXX的位置
    """
    #将结果整合到一个表中,即上述中的第一个
    interval = []
    interval_num = np_regroup.shape[0]
    for i in range(interval_num):
        if i == 0:
            interval.append('x<=%f'%(np_regroup[i,0]))
        elif i == interval_num-1:
            interval.append('x>%f'%(np_regroup[i-1,0]))
        else:
            interval.append('x>%f and x<=%f'%(np_regroup[i-1,0],np_regroup[i,0]))

    result = pd.DataFrame(np_regroup)
    result[0] = interval
    result.columns = ['interval']+tags

    #整理series的命令,即上述中的第二个
    premise = "str(0) if "
    length_interval = len(interval)
    for i in range(length_interval):
        if i == length_interval-1:
            premise = premise[:-4]
            break
        premise = premise + interval[i] + " else " + 'str(%d+1)'%i + " if "

    return result,premise
验证分箱结果
为了方便观察,我以二分类为例子进行展示。
首先我们先构造数据集,数据集的目的很明显,针对不同的x取值区间,y=1的概率不同。我们就是验证卡方分箱是否能找到这个规律。
#构造一个有40000数据量的数据
num = 10000
x1 = np.random.randint(1,10,(1,num))
x2 = np.random.randint(10,30,(1,num))
x3 = np.random.randint(30,45,(1,num))
x4 = np.random.randint(45,80,(1,num))
x = list(x1[0])+list(x2[0])+list(x3[0])+list(x4[0])

y1 = [0 for i in range(int(num*0.9))]+[1 for i in range(int(num*0.1))]
y2 = [0 for i in range(int(num*0.7))]+[1 for i in range(int(num*0.3))]
y3 = [0 for i in range(int(num*0.5))]+[1 for i in range(int(num*0.5))]
y4 = [0 for i in range(int(num*0.3))]+[1 for i in range(int(num*0.7))]
y = y1+y2+y3+y4

testdata = pd.DataFrame({"x":x,"y":y})
#打乱顺序,其实没必要,分箱的时候会重新对x进行排序
testdata = testdata.sample(frac=1)
数据集中只有一个变量x和标签y。我们对不同x的取值下y=1的概率(也就是取值为1的个数占总个数的比值)
testdata.groupby(by='x')['y'].mean().sort_index().plot()

画图结果符合我们构造的数据集的规律,卡方分箱的结果预期结果大概是如下几个分割点[10,30,45]。让我们来看一下结果吧。
ChiMerge3(testdata,100,[0,1],pvalue_edge=0.05)

可以看到,结果和我们预期的有些不同,多了两个取值点13和17。我们看一下最终的pvalue值,这两个取值点附近pvalue为4.67660460e-002 和1.82155359e-002,与其他的分割点完全不在一个数量级,因此,我们可以考虑通过调整pvalue阈值的方式,使用pvalue=0.01重新跑一次卡方分箱。(其实也可以调整biggst参数,限制最大分箱数)
result,sentence=ChiMerge3(testdata,100,[0,1],pvalue_edge=0.01)
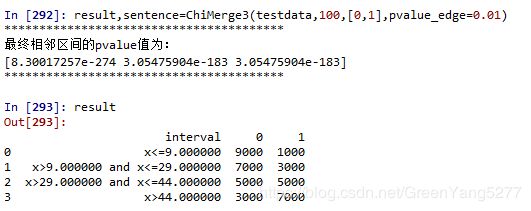
result

这次我们跑出来的结果与预期几乎一样,理论值[10,30,45],实际得到分割点[9,29,44]。
由于数据是随机生成,在区间的分割点会存在抖动,因此产生1的误差属于正常现象。
我们再使用调整最大分箱数的方法。
result,sentence=ChiMerge3(testdata,100,[0,1],biggest=4)

可以看到,得到了同样的结果。与理论值一致。
经过数据验证,我们可以发现,卡方分箱可以寻找到比较好的分割点,比等距和等频的傻瓜分箱方式优势明显。实际项目中数据没有这么理想化,因此需要通过画图或使用IV值等评价手段进行评价。卡方分箱的参数并不是一成不变的,需要根据实际问题实际考虑。
结果的使用
返回值有两个,premise是干什么用的?
这部分有经验的就忽略吧,我给小白讲一讲。
我们看一下premise返回值是什么,以最后一次得到的结果为例。

也就是这一句:
‘str(0) if x<=9.000000 else str(0+1) if x>9.000000 and x<=29.000000 else str(1+1) if x>29.000000 and x<=44.000000 else str(2+1)’
他可以轻松的直接将数据进行分箱,代码如下
testdata['x'].apply(lambda x:str(0) if x<=9.000000 else str(0+1) if x>9.000000 and x<=29.000000 else str(1+1) if x>29.000000 and x<=44.000000 else str(2+1))
然后数据集可以直接进行one-hot编码处理了。否则你还要根据返回的分割点,手打这条命令。
哈哈,就是点小聪明。
结论
由于数据初始化的时候每个人得到的数据不尽相同,所以在一开始运行时得到的结果可能不同,但是调整pvalue和biggest等参数后,应该可以得到近乎相同的结果。
欢迎一起讨论数据分析中用到的技术。