猫眼电影-分析及展示(Python+pycharts)
此篇文章承接(猫眼电影-爬取)。
![]()
将电影数据储存到MySQL中后,发现评论人数和票房的数据当中存在汉字,后期不好分析,所以需要将汉字转化为数值。
保险起见,我先将films表里面的结构和数据复制了成了一个新表films_copy,然后新增了2列,people和box_price。

将数据转化为便于分析的数据,代码如下:
import pymysql


def get_data():
    data1 = []
    data2 = []
    db = pymysql.connect(host='localhost', user='root', passwd='password', db='maoyan', port=3306)
    cursor = db.cursor()
    sql = "SELECT score_hum,box_office FROM films_copy"
    try:
        cursor.execute(sql)
        results = cursor.fetchall()
        for item in results:
            if '万' in item[0]:
                change0 = item[0]
                change1 = int(float(item[0].replace('万', '')) * 10000)
                data1.append((change1, change0))
            else:
                change0 = item[0]
                change1 = item[0]
                data1.append((change1, change0))
            if '万' in item[1]:
                if '美元' in item[1]:
                    change0 = item[1]
                    change2 = int(float(item[1].replace('万美元', '')) * 10000 * 6.8)
                    data2.append((change2, change0))
                else:
                    change0 = item[1]
                    change2 = int(float(item[1].replace('万', '')) * 10000)
                    data2.append((change2, change0))
            elif '亿' in item[1]:
                if '美元' in item[1]:
                    change0 = item[1]
                    change2 = int(float(item[1].replace('亿美元', '')) * 100000000 * 6.8)
                    data2.append((change2, change0))
                else:
                    change0 = item[1]
                    change2 = int(float(item[1].replace('亿', '')) * 100000000)
                    data2.append((change2, change0))
            else:
                change0 = item[1]
                data2.append((item[1], change0))
    except:
        print("something wrong")
    db.close()
    return data1,data2

def change_hum(data1)
    for i in range(len(data1)):
        db = pymysql.connect(host='localhost', user='root', passwd='password', db='maoyan', port=3306)
        cursor = db.cursor()
        sql1 = "UPDATE films_copy SET people = '%s' WHERE score_hum = '%s'" %(data1[i][0], data1[i][1])
        print(data1[i][0], data1[i][1])
        try:
            if cursor.execute(sql1):
                print('Successful')
                db.commit()
        except:
            db.rollback()
            print('Falied')
        db.close()

def change_prices(data2):
    for i in range(len(data2)):
        db = pymysql.connect(host='localhost', user='root', passwd='password', db='maoyan', port=3306)
        cursor = db.cursor()
        sql2 = "UPDATE films_copy SET box_price = '%s' WHERE box_office = '%s'" %(data2[i][0], data2[i][1])
        try:
            if cursor.execute(sql2):
                print('Successful')
                db.commit()
        except:
            db.rollback()
            print('Falied')
        db.close()

def main():
    data1 = get_data()[0]
    data2 = get_data()[1]
    change_hum(data1)
    change_prices(data2)

if '__name__' == '__main__':
    main()
现在开始分析数据:(按照公众号作者的代码操作,一直没有出现作者文章中的效果,所以找解决方法找了很久)
1,2018年电影评分TOP10
from pyecharts import Bar
import pandas as pd
import numpy as np
import pymysql

conn = pymysql.connect(host='localhost', user='root', passwd='password', db='maoyan', port=3306, charset='utf8mb4')
cursor = conn.cursor()
sql = 'select * from films_copy'
db = pd.read_sql(sql, conn)
df = db.sort_values(by='score', ascending=False)
dom = df[['name', 'score']]

v1 = dom['score'][0:10]
attr = dom['name'][0:10]

bar = Bar("2018年电影评分TOP10", title_pos='center', title_top='18', width=800, height=400)
bar.add('',
        attr,
        v1,
        xaxis_min=8,
        xaxis_max=9.8,
        is_yaxis_boundarygap=True,
        is_xaxis_boundarygap=True,
        is_label_show=True,
        is_legend_show=False,
        label_pos='right',
        is_yaxis_inverse=True,
        is_convert=True,
       yaxis_label_textsize=10)
bar.render("2018年电影评分TOP10-2.html")
因为代码运行环境是jupyter,所以出现的效果是x轴与y轴互换之后,y轴的文本没有出现,然后一直在网络上找原因与解决办法。

后来升级了jupyter版本,以及将jupyter-echarts-pypkg==0.1.1,然后运行还是不行,y轴还是像上图一下,但是用网页打开就是正常的了,可还是出现了一个问题,就是y轴文本太长,只能显示部分文字了。

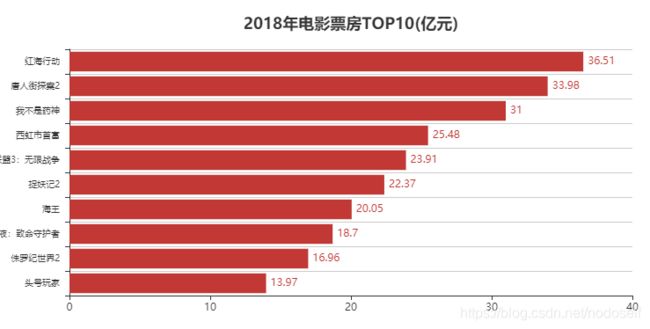
2.电影票房TOP10
dom = df[['name', 'box_price']].sort_values(by='box_price', ascending=False)


v1 = round(dom['box_price'][0:10]/100000000, 2)

attr = dom['name'][0:10]

bar = Bar("2018年电影票房TOP10(亿元)", title_pos='center', title_top='18', width=800, height=400)
bar.add('',
        attr,
        v1,
        is_yaxis_boundarygap=True,
        is_xaxis_boundarygap=True,
        is_label_show=True,
        is_legend_show=False,
        label_pos='right',
        is_yaxis_inverse=True,
        is_convert=True,
       yaxis_label_textsize=10)
bar.render("2018年电影票房TOP10.html")
bar
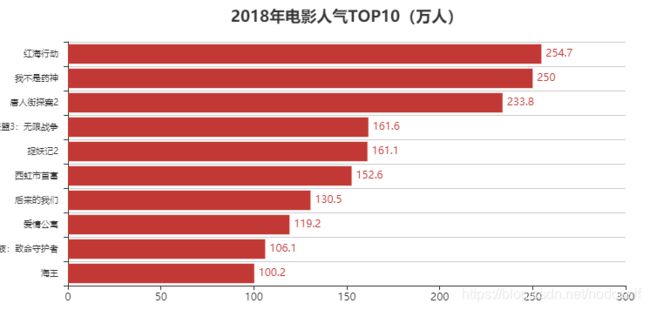
3.2018年电影人气TOP10
dom = df[['name', 'people']].sort_values(by='people', ascending=False)


v1 = round(dom['people'][0:10]/10000, 2)

attr = dom['name'][0:10]

bar = Bar("2018年电影人气TOP10(万人)", title_pos='center', title_top='18', width=800, height=400)
bar.add('',
        attr,
        v1,
        is_yaxis_boundarygap=True,
        is_xaxis_boundarygap=True,
        is_label_show=True,
        is_legend_show=False,
        label_pos='right',
        is_yaxis_inverse=True,
        is_convert=True,
       yaxis_label_textsize=10)
bar.render("2018年电影人气TOP10.html")
4.2018年电影名利双收TOP10
def my_sum(a, b, c):
    rate = (a + b) / c
    result = float('%.4f' % rate)
    return result

db['sort_num_money'] = db['box_price'].rank(ascending=0, method='dense')
db['sort_num_score'] = db['score'].rank(ascending=0, method='dense')
db['value'] = db.apply(lambda row:my_sum(row['sort_num_money'], row['sort_num_score'], len(db.index)), axis=1)
df = db.sort_values(by="value", ascending=True)[0:10]


v1 = ["{}".format('%.2f' % ((1-i)* 100))for i in df['value']]
attr = np.array(df['name'])
attr = ["{}".format(i.replace(':无限战争', '').replace(':全面瓦解', '')) for i in attr]#为什么可以直接在.replace后面再加上.replace


bar = Bar("2018年电影名利双收TOP10(%)", title_pos='center', title_top='18', width=800, height=400)
bar.add('',
        attr,
        v1,
        xaxis_max=100,
        xaxis_min=90,
        is_yaxis_boundarygap=True,
        is_xaxis_boundarygap=True,
        is_label_show=True,
        is_legend_show=False,
        label_pos='right',
        is_yaxis_inverse=True,
        is_convert=True)
bar.render("2018年电影名利双收TOP10.html")
bar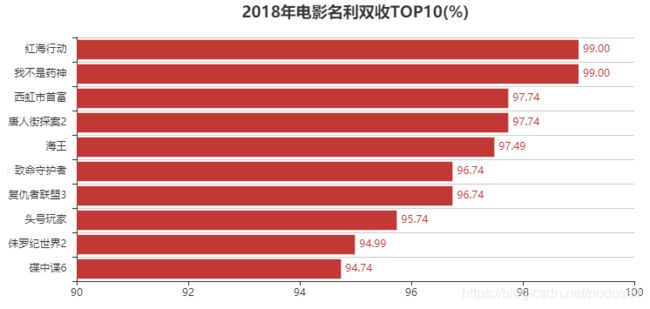
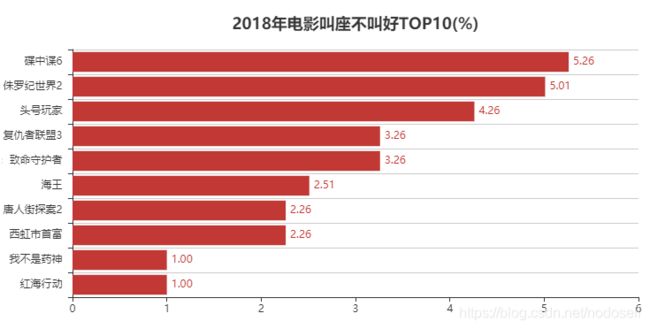
5.2018年电影叫座不叫好TOP10
def my_sub(a, b, c):
    rate = (a - b) / c
    result = float('%.4f' % rate)
    return result

db['sort_num_money'] = db['box_price'].rank(ascending=0, method='dense')
db['sort_num_score'] = db['score'].rank(ascending=0, method='dense')
db['value'] = db.apply(lambda row:my_sum(row['sort_num_money'], row['sort_num_score'], len(db.index)), axis=1)
df = db.sort_values(by="value", ascending=True)[0:10]


v1 = ["{}".format('%.2f' % (i * 100)) for i in df['value'][::-1]]
# v1 = ["{}".format('%.2f' % (i * 100)) for i in df['value']]
attr = np.array(df['name'])
# attr = ["{}".format(i.replace(':无限战争', '').replace(':全面瓦解', '')) for i in attr]#为什么可以直接在.replace后面再加上.replace
attr = ["{}".format(i.replace(':无限战争', '').replace(':全面瓦解', '')) for i in attr[::-1]]

bar = Bar("2018年电影叫座不叫好TOP10(%)", title_pos='center', title_top='18', width=800, height=400)
bar.add('',
        attr,
        v1,
        xaxis_max=6,
        xaxis_min=0,
        is_yaxis_boundarygap=True,
        is_xaxis_boundarygap=True,
        is_label_show=True,
        is_legend_show=False,
        label_pos='right',
        is_yaxis_inverse=True,
        is_convert=True)
bar.render("2018年电影叫座不叫好TOP10.html")
bar
6.2018年每月电影上映数量
首先,我是按照自己的想法做的,然后发现数据结果跟作者的不一致。
dateOne = df[['name','released']]
month0 = []
for i in df['released']:
    St = i.split('-')
    month0.append(St[1][:2])
# df['months'] = np.array(month0)
monthUq = set (month0)
monthSo = [i for i in monthUq]
monthSo.sort()
data0 = {}
for i in monthSo:
    data0[i] = month0.count(i)
print(data0)

v1 = [value for value in data0.values()]
attr = [key + '月' for key in data0.keys()]

print(v1)

bar = Bar("2018年电影每月上映数量)", title_pos='center', title_top='18', width=800, height=400)
bar.add('',
        attr,
        v1,
        is_xaxis_boundarygap=True,
        is_label_show=True,
        is_legend_show=False,
        label_pos='top'
       )
bar.render("2018年电影每月上映数量.html")
bar
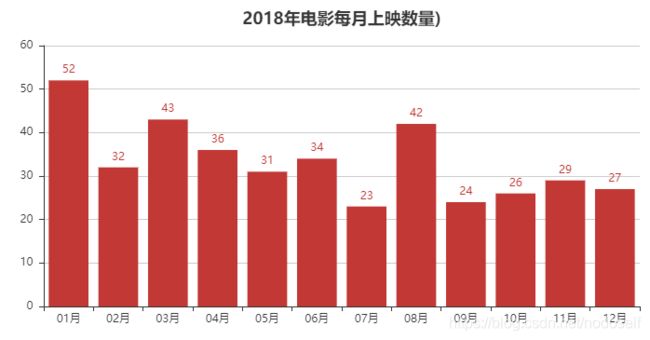
以下为公众号作者代码,最后结果与上图一致,但是跟作者在公众号上的数据展示不一致,虽然我的数据多了一个12月,但是之前的月份电影数量应该是一致的,除非猫眼后期又更新了数据。
df = db.sort_values(by="released", ascending=False)
dom = df[['name','released']]
month0 = []
for i in dom['released']:
    St = i.split('-')
    month0.append(St[1][:2])

db['month'] = month0

month_message = db.groupby(['month'])
month_com = month_message['month'].agg(['count'])
month_com.reset_index(inplace=True)
month_com_last = month_com.sort_index()

attr = ["{}".format(str(i)+'月') for i in range(1, 13)]
v1 = np.array(month_com_last['count'])
v1 = ["{}".format(i) for i in v1]

# print(attr, v1)
bar = Bar("2018年电影每月上映数量", title_pos='center', title_top='18', width=800, height=400)
bar.add('',
        attr,
        v1,
        is_label_show=True
       )
bar.render("2018年电影每月上映数量.html")
bar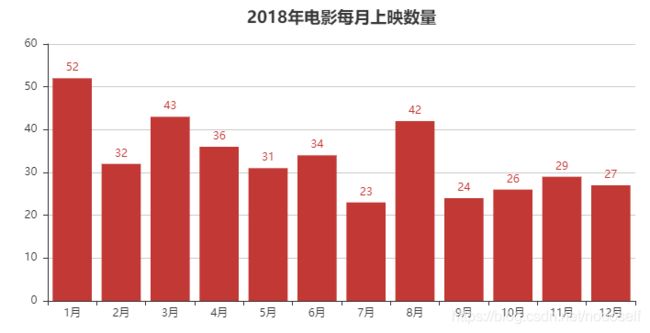
7.2018年每月电影上映票房
不知道为什么,我按照作者的代码写的,但是发现跟我实际的数据有出入。以下是作者的代码:
df = db.sort_values(by="released", ascending=False)
dom = df[['name','released']]
month0 = []
for i in dom['released']:
    St = i.split('-')
    month0.append(St[1][:2])

db['month'] = month0

month_message = db.groupby(['month'])
month_com = month_message['box_price'].agg(['sum'])
month_com.reset_index(inplace=True)
month_com_last = month_com.sort_index()

attr = ["{}".format(str(i)+'月') for i in range(1, 13)]
v1 = np.array(month_com_last['sum'])

v1 = ["{}".format(float('%.2f' % (float(i) / 100000000))) for i in v1]

# print(attr, v1)
bar = Bar("2018年电影每月票房", title_pos='center', title_top='18', width=800, height=400)
bar.add('',
        attr,
        v1,
        is_label_show=True
       )
bar.render("2018年电影每月票房.html")
bar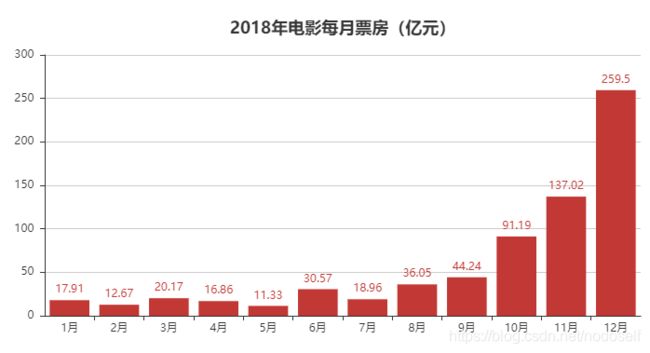
上图1月份的数据为17.91亿,但是我用mysql算出来的是51.76亿。以下为我的代码,终于跟我用mysql算出来的一样了。
# df = db.sort_values(by="released", ascending=False)
dom = db[['name','released']]
month0 = []
for i in dom['released']:
    St = i.split('-')
    month0.append(St[1][:2])

db['month'] = month0
grouped = db['box_price'].groupby(db['month'])
sums = grouped.sum()

attr = ["{}".format(str(i)+'月') for i in range(1, 13)]
v1 = np.array(sums)

v1 = ["{}".format(float('%.2f' % (float(i) / 100000000))) for i in v1]

# print(attr, v1)
bar = Bar("2018年电影每月票房(亿元)", title_pos='center', title_top='18', width=800, height=400)
bar.add('',
        attr,
        v1,
        is_label_show=True
       )
bar.render("2018年电影每月票房(亿元).html")
bar
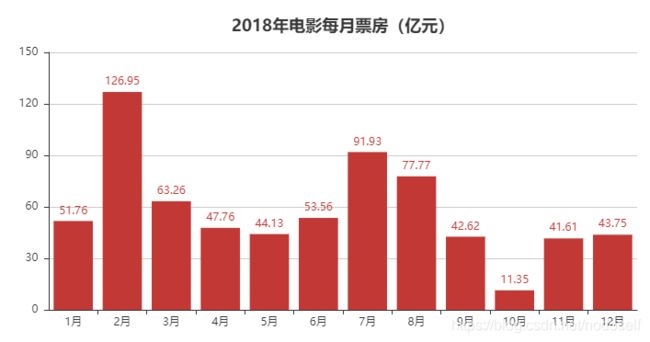
按照我的数据显示2月份为票房最高月份。毕竟除夕在2月,情人节也在2月。而7月,8月正值学生的暑假期间,学生也是贡献票房的主力军。
8.2018年各国家电影数量TOP10
countrys = []
datas = {}
for i in  db['country']:
    St = i.split(',')
    for j in St:
        countrys.append(j)
countrysUq = set(countrys)
for i in countrysUq:
    datas[i] = countrys.count(i)

dic1SortList = sorted( datas.items(),key = lambda x:x[1],reverse = True)

v1 = ["{}".format(i[1]) for i in dic1SortList][0:10]
attr = ["{}".format(i[0]) for i in dic1SortList][0:10]

bar = Bar("2018年各国电影数量TOP10", title_pos='center', title_top='18', width=800, height=400)
bar.add('',
        attr,
        v1,
        is_xaxis_boundarygap=True,
        is_label_show=True,
        is_legend_show=False,
        label_pos='top'
       )
bar.render("2018年各国电影数量TOP10.html")
bar

2018年中国和美国上映电影要远大于其他国家。
9,2018年中外电影票房对比(亿元)
country_group = []
for i in db['country']:
    if i[:2] == '中国':
        St = '中国'
        country_group.append(St)
    else:
        St = '外国'
        country_group.append(St)
db['Country_group'] = country_group

grouped = db['box_price'].groupby(db['Country_group'])
sums = grouped.sum()

attr = ["中国", "外国"]
v1 = [i for i in sums]
v1 = ["{}".format(float('%.2f'% (float(i)/100000000))) for i in v1]


def label_formatter(params):
    return params.value
pie = Pie("2018年中外电影票房对吧(亿元)", title_pos='center')
pie.add("",
       attr,
       v1,
       radius=[40, 75],
       label_text_color=None,
       is_label_show=True,
       legend_orient="vertical",
       legend_pos="left",
       label_formatter=label_formatter
       )
pie.render("2018n年中外电影票房对比.html")
pie
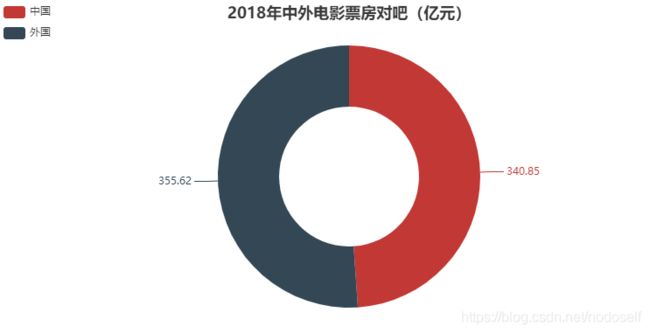
以上数据可以看出,中国的票房还是略低于外国的票房的。
10.2018年电影类型分布图
types = []
datas = {}
for i in db['type']:
    St = i.split(',')
    for j in St:
        types.append(j)
typeUq = set (types)
for i in typeUq:
    datas[i] = types.count(i)
def message():
    for i in datas:
        data = {}
        data['name'] = i + ' ' + str(datas[i])
        data['value'] = datas[i]
        yield data

data0 = message()
dom = []
for item in data0:
    dom.append(item)

# print(dom)


treemap = TreeMap("2018年电影类型分布图", title_pos='center', title_top='5', width=800, height=400)
treemap.add('数据',
            dom,
            is_label_show=True,
            label_pos='inside',
            is_legend_show=False
           )
treemap.render('2018年电影类型分布图.html')
treemap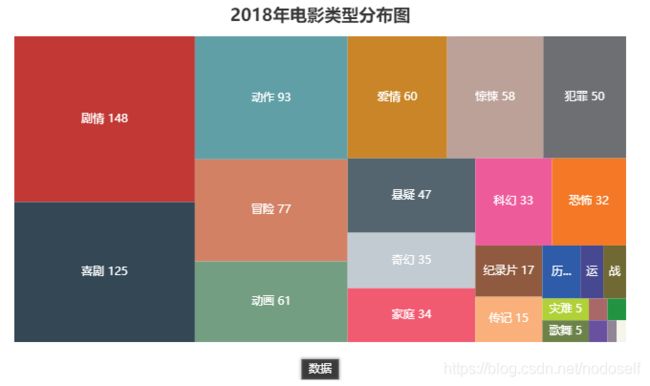
按作者公众号操作的电影分析到此结束,鼓掌。因为从作者的文字中接触到了pyecharts,这对于我而言是一个新的知识,所以还需要再练习练习。