sklear中IsolationForest的使用场景
背景描述
产品层面要求提供针对时间序列的异常检测功能,并且明确使用“独立森林”算法,考虑到产品之前相关功能(如自动分类)使用了sklearn实现,因此,先了解下sklearn中提供的“独立森林”算法,是否满足需求。
先表结论
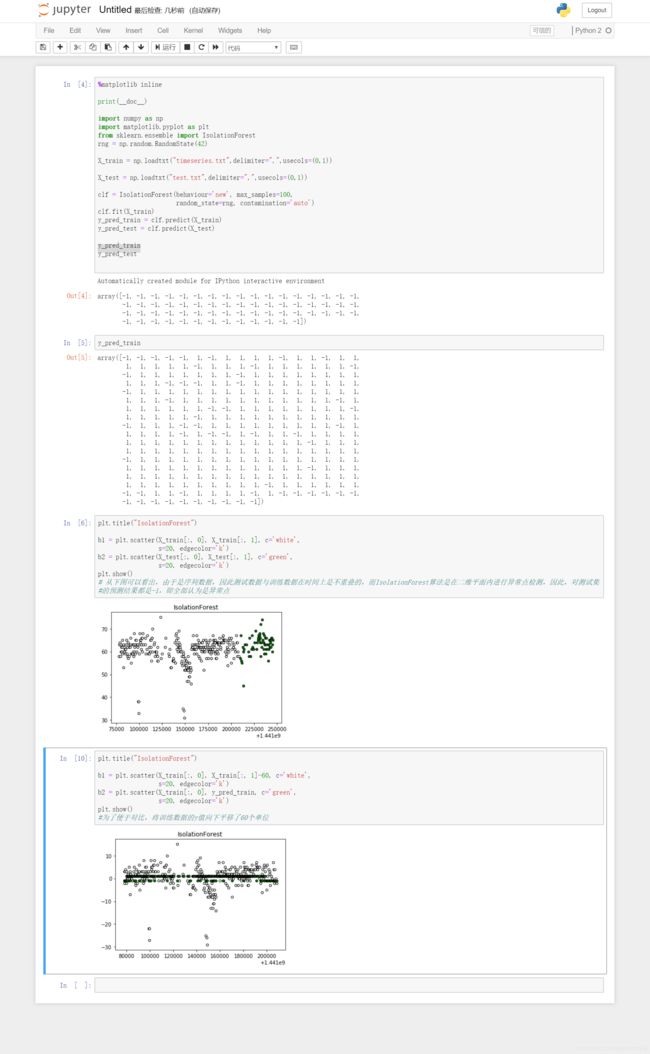
Sklearn包提供了孤立森林算法即IsolationForest方法,但该方法用于在二维平面中检测异常点,并不能用于时间序列的异常点检测场景。
验证过程
1、准备数据
https://github.com/numenta/NAB
上述gitlab项目下提供了时序数据,示例数据如下所示:
timestamp,value
2015-09-01 11:25:00,58
2015-09-01 11:30:00,63
2015-09-01 11:35:00,63
2015-09-01 11:40:00,64
需要注意的是,由于IsolationForest接收的数据类型(array)要求都是数值类型的,因此需要将标准日期格式转换为unix时间戳,从而满足输入要求。
最后转换后的数据如下所示(转换过程利用EXCEL实现):
1441077900,58
1441078200,63
1441078500,63
1441078800,64
1441079700,58
1441080000,63
1441080300,60
1441080600,60
2、代码
%matplotlib inline

print(__doc__)

import numpy as np
import matplotlib.pyplot as plt
from sklearn.ensemble import IsolationForest
rng = np.random.RandomState(42)

X_train = np.loadtxt("timeseries.txt",delimiter=",",usecols=(0,1))

X_test = np.loadtxt("test.txt",delimiter=",",usecols=(0,1))

clf = IsolationForest(behaviour='new', max_samples=100,
                      random_state=rng, contamination='auto')
clf.fit(X_train)
y_pred_train = clf.predict(X_train)
y_pred_test = clf.predict(X_test)

y_pred_train
y_pred_test
查看y_pred_train可以看出,数值的值由1和-1,而y_pred_test的值则全是-1,经过分析,因为IsolationForest是在二维平面上进行异常点检测的,而测试数据集,由于其中一维是时间戳,肯定是偏离于训练数据的,因此必然会被认为是异常值。
验证截图如下所示:
