Python笔记——Python3.4+Matplotlib详细安装教程
Python3.4+Matplotlib安装步骤
1、到官网https://www.python.org/downloads/下载python3.4.3
2、为python配置环境变量
3、ctrl+r 输入cmd打开 终端,输入python查询python版本

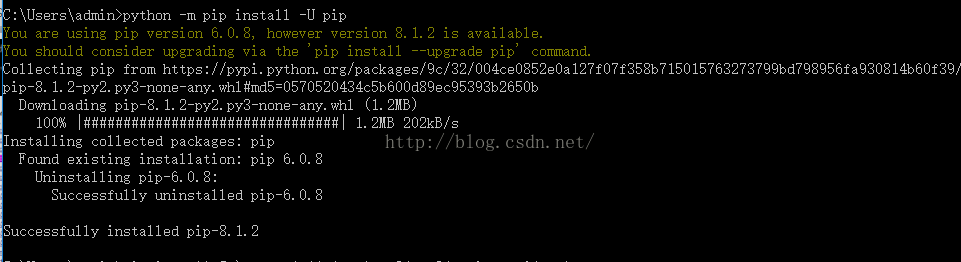
4、在终端输入python -m pip install -U pip
如下图:
注:安装Matplotlib需要库的支持,如下图:
![]()
在这里我们安装NumPy,SciPy即可运行,后面需要再补充安装
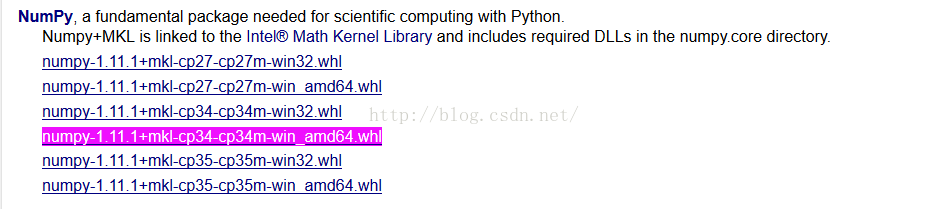
5、到http://www.lfd.uci.edu/~gohlke/pythonlibs/点击打开链接下载numpy,版本根据自己系统选择,如图:
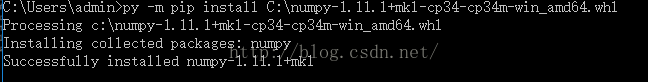
6、安装Numpy,根据下载的版本和你存放numpy-1.11.1+mkl-cp34-cp34m-win_amd64.whl的位置来安装,如存放位置为C盘根目录下执行下面命令:
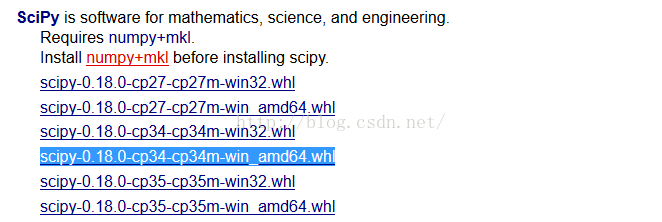
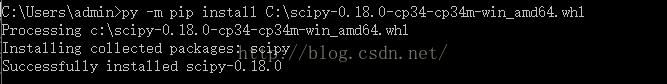
7、安装SciPy,下载链接点击打开链接,安装步骤跟Numpy一样:如下图
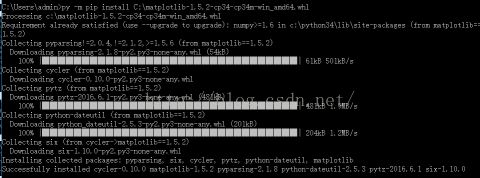
8、安装Matplotlib,下载链接点击打开链接 ,安装步骤同上,如图:

至此安装完成。
建立py文件
import numpy as np
import matplotlib.pyplot as plt

N = 5
menMeans = (20, 35, 30, 35, 27)
menStd =   (2, 3, 4, 1, 2)

ind = np.arange(N)  # the x locations for the groups
width = 0.35       # the width of the bars

fig, ax = plt.subplots()
rects1 = ax.bar(ind, menMeans, width, color='r', yerr=menStd)

womenMeans = (25, 32, 34, 20, 25)
womenStd =   (3, 5, 2, 3, 3)
rects2 = ax.bar(ind+width, womenMeans, width, color='y', yerr=womenStd)

# add some
ax.set_ylabel('Scores')
ax.set_title('Scores by group and gender')
ax.set_xticks(ind+width)
ax.set_xticklabels( ('G1', 'G2', 'G3', 'G4', 'G5') )

ax.legend( (rects1[0], rects2[0]), ('Men', 'Women') )

def autolabel(rects):
    # attach some text labels
    for rect in rects:
        height = rect.get_height()
        ax.text(rect.get_x()+rect.get_width()/2., 1.05*height, '%d'%int(height),
                ha='center', va='bottom')

autolabel(rects1)
autolabel(rects2)

plt.show()
运行效果如下图:

此时如果你安装了pyqt5,可以尝试:
import sys
import random

import matplotlib
matplotlib.use("Qt5Agg")

from PyQt5 import QtCore
from PyQt5.QtWidgets import QApplication, QMainWindow, QMenu, QVBoxLayout, QSizePolicy, QMessageBox, QWidget

from numpy import arange, sin, pi
from matplotlib.backends.backend_qt5agg import FigureCanvasQTAgg as FigureCanvas
from matplotlib.figure import Figure


class MyMplCanvas(FigureCanvas):
    """这是一个窗口部件,即QWidget(当然也是FigureCanvasAgg)"""
    def __init__(self, parent=None, width=5, height=4, dpi=100):
        fig = Figure(figsize=(width, height), dpi=dpi)
        self.axes = fig.add_subplot(111)
        # 每次plot()调用的时候,我们希望原来的坐标轴被清除(所以False)
        self.axes.hold(False)

        self.compute_initial_figure()

        #
        FigureCanvas.__init__(self, fig)
        self.setParent(parent)

        FigureCanvas.setSizePolicy(self,
                                   QSizePolicy.Expanding,
                                   QSizePolicy.Expanding)
        FigureCanvas.updateGeometry(self)

    def compute_initial_figure(self):
        pass

class MyStaticMplCanvas(MyMplCanvas):
    """静态画布:一条正弦线"""
    def compute_initial_figure(self):
        t = arange(0.0, 3.0, 0.01)
        s = sin(2*pi*t)
        self.axes.plot(t, s)


class MyDynamicMplCanvas(MyMplCanvas):
    """动态画布:每秒自动更新,更换一条折线。"""
    def __init__(self, *args, **kwargs):
        MyMplCanvas.__init__(self, *args, **kwargs)
        timer = QtCore.QTimer(self)
        timer.timeout.connect(self.update_figure)
        timer.start(1000)

    def compute_initial_figure(self):
        self.axes.plot([0, 1, 2, 3], [1, 2, 0, 4], 'r')

    def update_figure(self):
        # 构建4个随机整数,位于闭区间[0, 10]
        l = [random.randint(0, 10) for i in range(4)]

        self.axes.plot([0, 1, 2, 3], l, 'r')
        self.draw()

class ApplicationWindow(QMainWindow):
    def __init__(self):
        QMainWindow.__init__(self)
        self.setAttribute(QtCore.Qt.WA_DeleteOnClose)
        self.setWindowTitle("程序主窗口")

        self.file_menu = QMenu('&File', self)
        self.file_menu.addAction('&Quit', self.fileQuit,
                                 QtCore.Qt.CTRL + QtCore.Qt.Key_Q)
        self.menuBar().addMenu(self.file_menu)

        self.help_menu = QMenu('&Help', self)
        self.menuBar().addSeparator()
        self.menuBar().addMenu(self.help_menu)

        self.help_menu.addAction('&About', self.about)

        self.main_widget = QWidget(self)

        l = QVBoxLayout(self.main_widget)
        sc = MyStaticMplCanvas(self.main_widget, width=5, height=4, dpi=100)
        dc = MyDynamicMplCanvas(self.main_widget, width=5, height=4, dpi=100)
        l.addWidget(sc)
        l.addWidget(dc)

        self.main_widget.setFocus()
        self.setCentralWidget(self.main_widget)
        # 状态条显示2秒
        self.statusBar().showMessage("matplotlib 万岁!", 2000)

    def fileQuit(self):
        self.close()

    def closeEvent(self, ce):
        self.fileQuit()

    def about(self):
        QMessageBox.about(self, "About",
        """embedding_in_qt5.py example
        Copyright 2015 BoxControL

        This program is a simple example of a Qt5 application embedding matplotlib
        canvases. It is base on example from matplolib documentation, and initially was
        developed from Florent Rougon and Darren Dale.

        http://matplotlib.org/examples/user_interfaces/embedding_in_qt4.html

        It may be used and modified with no restriction; raw copies as well as
        modified versions may be distributed without limitation.
        """
        )

if __name__ == '__main__':
    app = QApplication(sys.argv)

    aw = ApplicationWindow()
    aw.setWindowTitle("PyQt5 与 Matplotlib 例子")
    aw.show()
    #sys.exit(qApp.exec_())
    app.exec_()
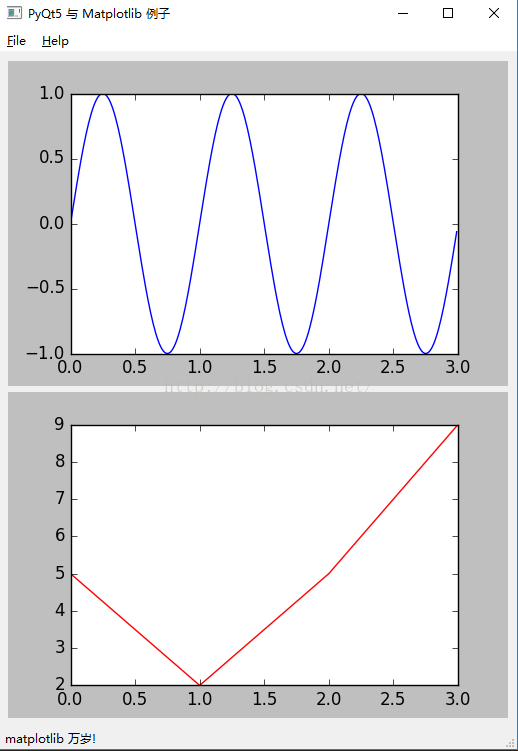
效果如下图: