机器学习--线性回归练习--Second_Chapter
线性回归带截距项
import numpy as np
import matplotlib.pyplot as plt
plt.rcParams['font.sans-serif']=['SimHei'] #显示中文标签
plt.rcParams['axes.unicode_minus']=False
from mpl_toolkits.mplot3d import Axes3D

def y_label_(k,x,b):
    y_label_ = k*x +b + np.random.randn(len(x))*0.2
    return y_label_

def linear_model(x,k_,b_):
    y_hat = k_* x + b_
    return y_hat

def loss_model(y_hat,y_label):
    loss  = 1/(2*len(y_hat))*np.sum((y_hat-y_label)**2)
    return loss


if __name__ =="__main__":
    x = np.arange(1, 10)
    b = 3
    y_label =  y_label_(1,x,1)
    k_ = np.arange(-10,10,1)
    b_ = np.arange(-10,10,1)
    plt.figure(figsize=(12, 8))
    plt.style.use("ggplot")
    i = 1
    loss_ = []
    k_list = []
    b_list = []
    for k_,b_ in zip(k_,b_):
        y_hat = linear_model(x,k_,b_)
        loss = loss_model(y_hat,y_label)
        k_list.append(k_)
        b_list.append(b_)
        loss_.append(loss)
        plt.subplot(4,5,i)
        plt.scatter(x, y_label)
        plt.plot(x, y_hat, linewidth=1, label="k={},b={}".format(k_,b_))
        plt.legend(loc=0)
        x_min, x_max = x.min()-2, x.max()+2
        y_min, y_max = np.min((y_label.min(), y_hat.min())) - 5, \
                       np.max((y_label.max(), y_hat.max())) + 5
        plt.xlim([x_min, x_max])
        plt.ylim([y_min, y_max])
        plt.locator_params("y", nbins=5)
        plt.locator_params("x", nbins=5)
        plt.xlabel("x", fontsize=15)
        plt.ylabel("y", fontsize=15)
        i += 1
    plt.show()

    fig = plt.figure(figsize=(12, 8))
    ax = Axes3D(fig)
    plt.style.use("ggplot")
    k1,b1 = np.meshgrid(k_list,b_list)
    k1_r = k1.ravel()
    b1_r = b1.ravel()
    Loss = []
    for k1_r,b1_r in zip(k1_r,b1_r):
        y_hat = linear_model(x,k1_r,b1_r)
        loss_r = loss_model(y_hat,y_label)
        Loss.append(loss_r)
    Loss = np.array(Loss)
    Loss = Loss.reshape(20,20)
    ax.scatter(k_list, b_list, loss_ ,color="g",s=200,label='parametric curve')
    ax.plot_surface(k1, b1, Loss, rstride=1, cstride=1, cmap='rainbow',alpha=0.5)
    plt.show()
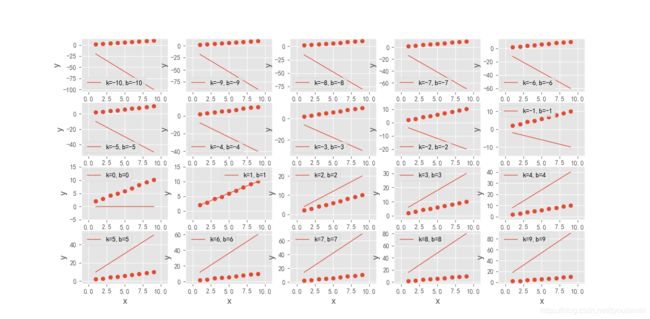
数据分布服从y = x+1
拟合方程为 y = kx + b
k,b取不同值时,拟合y = x+1程度不同
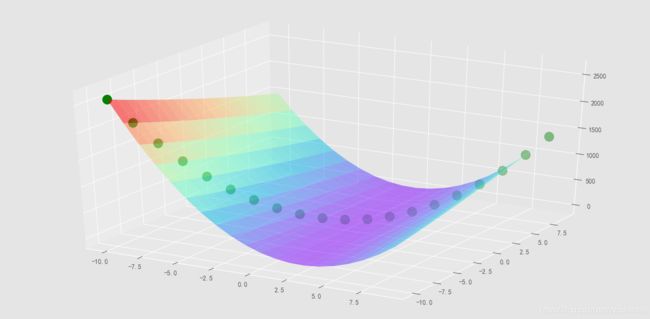
当k=1,b=1时,函数取到最小值时,
拟合情况最好,loss函数在不同的不同k,b下值取到最小

