集成学习笔记整理1
集成学习(集成方法)是一种解决问题的思想(不是具体的算法)。操作为将若干个基本评估器(分类器&回归器)进行组合,然后使用这些基本评估器来综合对未知样本进行预测。通过这种“集思广益”的行为,比起使用单个基本评估器进行预测,集成学习具有更好的泛化能力与稳健性。
1. 集成学习分类
集成学习可以分为以下两类:
- 平均方法
训练多个独立的基本评估器(评估器之间没有关联),然后对多个评估器的预测结果进行平均化。如果是分类任务,则使用多个评估器预测结果中,类别最多的作为预测结果。如果是回归任务,则使用多个评估器预测结果的均值作为预测结果。
平均方法通过综合考量的行为,可以有效的减少方差,因此,其预测结果通常可以优于任何一个基本评估器。 - 增强方法
多个基本评估器是按顺序训练的,然后将若干个模型(通常是弱评估器)进行组合,进而产生一个预测能力强的模型。与平均方法不同,增强方法的多个基本评估器不是独立的,后续评估器需要依赖于之前评估器,训练过程中,会试图减少组合之后评估器的偏差。
2. 集成学习效果
我们以二分类为例,如果存在n个分类器,每个分类器的错误率都为e且各个分类器之间是独立的。因此,多个分类器集成之后的错误率服从二项分布,其中,k个分类器出错的概率密度可表示为:
P ( y = k ) = C n k e k ( 1 − e ) n − k P(y=k) = C_n^ke^k(1-e)^{n-k} P(y=k)=Cnkek(1−e)n−k
假设现有11个分类器,单个分类器的错误率为0.25,则如果集成分类器出错,则至少需要6个(或6个以上)的分类器出错,集成后分类器出错的概率密度为:
P ( y ⩾ k ) = ∑ k = 6 n C 11 k 0.2 5 k ∗ 0.7 5 11 − k = 0.034 P(y\geqslant k) = \sum_{k=6}^{n}C_{11}^k0.25^k * 0.75^{11-k} = 0.034 P(y⩾k)=∑k=6nC11k0.25k∗0.7511−k=0.034
可见,集成后分类器的出错率要远小于单个分类器的出错率。
# 计算组合值。
from scipy.special import comb
import numpy as np
import matplotlib as mpl
import matplotlib.pyplot as plt

mpl.rcParams["font.family"] = "SimHei"
mpl.rcParams["axes.unicode_minus"] = False

# 用来计算集成分类器发生错误的概率密度值。
# n:基本评估器的数量。
# error:每一个基本评估器发生错误的概率。
def ensemble_error(n, error):
    # 如果要使集成评估器预测错误,则需要半数以上的基本评估器发生错误。
    # 这里计算半数评估器的值。
    start = np.ceil(n / 2.0)
    # 计算令集成评估器发生错误,基本评估器错误个数的区间。
    k = np.arange(start, n + 1)
    v = comb(n, k) * error ** k * (1-error) ** (n - k)
    return np.sum(v, axis=1)

# 定义基本评估器发生错误的概率区间。
error = np.arange(0.0, 1.01, 0.01)
# 计算在不同error取值的情况下,集成评估器发生错误的概率。
ens_errors = ensemble_error(n=11, error=error[:, np.newaxis])
plt.plot(error, ens_errors, label="集成分类器")
plt.plot(error, error, linestyle="--", label="基本分类器")
plt.xlabel("基本分类器错误率")
plt.ylabel("基本/集成分类器错误率")
plt.legend(loc="best")
plt.title("集成分类器效果")
plt.grid()
plt.show()
def ensemble_error(n, error):
    # 如果要使集成评估器预测错误,则需要半数以上的基本评估器发生错误。
    # 这里计算半数评估器的值。
    start = np.ceil(n / 2.0)
    # 计算令集成评估器发生错误,基本评估器错误个数的区间。
    k = np.arange(start, n + 1)
    v = comb(n, k) * error ** k * (1-error) ** (n - k)
    print(v)
    return np.sum(v, axis=1)

ensemble_error(11, np.array([[0.25], [0.35]]))
3. Bagging
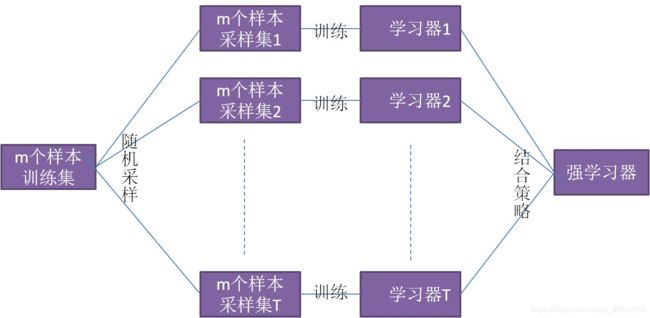
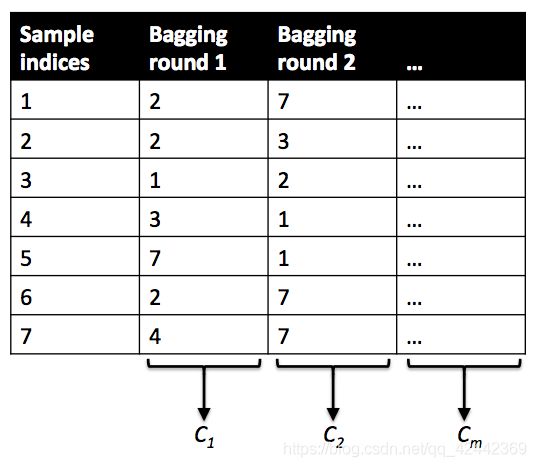
Bagging方法也称为汇聚法(Bootstrap Aggregating),该模型是一种元评估器。方法过程为:在原始数据集上进行随机抽样(抽样可以是放回抽样与不放回抽样),使用得到的随机子集来训练评估器,该过程重复若干次。然后使用得到的若干个评估器(一次训练获取一个评估器),最后聚合每个单独的评估器的预测,形成最终的预测结果。
预测会使用多数投票(分类)或者求均值(回归)的方式来统计最终的结果(平均方法)。
3.1 优势
bagging方法通过随机抽样来构建原始数据集的子集,来训练不同的基本评估器,然后再将多个基本评估器进行组合来预测结果,这样可以有效减小基本评估器的方差。因此,通过bagging方法,就可以非常便捷的对基本评估器进行改进,而无需去修改基本评估器底层的实现。
因为bagging方法可以有效的降低过拟合,因此,bagging方法适用于强大而复杂的模型。
3.2 bagging分类示例
from sklearn.datasets import make_classification
from sklearn.linear_model import LogisticRegression
# sklearn.ensemble 该模块存放的都是关于集成算法相关的内容。
# BaggingClassifier sklearn中提供用于分类的bagging模型。
# RandomForestClassifier sklearn中体用用于分类的随机森林模型。
from sklearn.ensemble import BaggingClassifier, RandomForestClassifier
from sklearn.model_selection import train_test_split

X, y = make_classification(n_samples=1000, n_features=20, n_informative=15, n_classes=3, random_state=0)
X_train, X_test, y_train, y_test = train_test_split(X, y, test_size=0.4, random_state=0)

lr = LogisticRegression()
lr.fit(X_train, y_train)
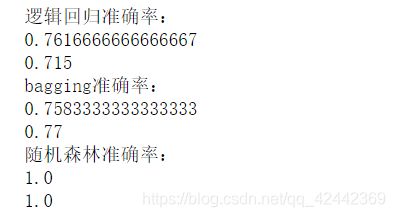
print("逻辑回归准确率:")
print(lr.score(X_train, y_train))
print(lr.score(X_test, y_test))
print("bagging准确率:")
# base_estimator:指定基本评估器。即bagging算法所组合的评估器。
# n_estimators:基本评估器的数量。(有多少个评估器,就会进行多少次随机采样,就会产生多少个原始数据集的子集。)
# max_samples:每次随机采样的样本数量。该参数可以是int类型或float类型。如果是int类型,则指定采样的样本数量。
# 如果是float类型,则指定采样占原始数据集的比例。
# max_features:每次随机采样的特征数量。可以是int类型或float类型。
# bootstrap:指定是否进行放回抽样。默认为True。
# bootstrap_features:指定对特征是否进行重复抽取。默认为False。
bag = BaggingClassifier(lr, n_estimators=100, max_samples=0.5, max_features=0.75)
bag.fit(X, y)
print(bag.score(X_train, y_train))
print(bag.score(X_test, y_test))
print("随机森林准确率:")
# n_estimators:随机森林评估器(决策树)的数量。
# criterion不存度度量方式。
# max_depth:树的最大深度。
# min_samples_split:节点最小分裂的样本数量。
# max_features:选择特征的数量。
# bootstrap:是否放回抽样。
rf = RandomForestClassifier(n_estimators=100, criterion="gini", random_state=0)
rf.fit(X, y)
print(rf.score(X_train, y_train))
print(rf.score(X_test, y_test))
3.3 bagging回归示例
from sklearn.datasets import load_diabetes
from sklearn.linear_model import LinearRegression
# sklearn提供的用于回归的bagging模型。
# sklearn提供的用于回归的随机深林模型。
from sklearn.ensemble import BaggingRegressor, RandomForestRegressor
from sklearn.model_selection import train_test_split

X, y = load_diabetes(return_X_y=True)
X_train, X_test, y_train, y_test = train_test_split(X, y, test_size=0.4, random_state=0)

lr = LinearRegression()
lr.fit(X_train, y_train)
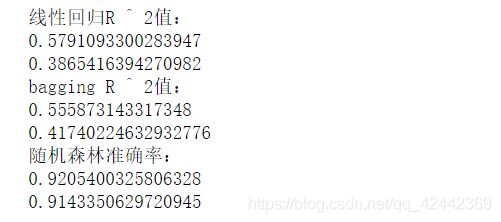
print("线性回归R ^ 2值:")
print(lr.score(X_train, y_train))
print(lr.score(X_test, y_test))
bag = BaggingRegressor(lr, n_estimators=100, max_samples=0.5, max_features=0.75)
bag.fit(X, y)
print("bagging R ^ 2值:")
print(bag.score(X_train, y_train))
print(bag.score(X_test, y_test))
print("随机森林准确率:")
rf = RandomForestRegressor(n_estimators=100, criterion="mse", random_state=0)
rf.fit(X, y)
print(rf.score(X_train, y_train))
print(rf.score(X_test, y_test))
3.4 结论
从以上两例的运行结果可知,bagging算法可以降低模型的方差,但是,在降低模型偏差方面,作用不大。
4. 随机森林(Random Forest)
随机森林(Random Forest)是一种元评估器,其使用原始数据集的子集来训练多棵决策树,并使用平均方法来计算预测结果。在随机森林中,用于训练决策树的子集样本数量与原始数据集的样本数量是相同的,其实现为:
- 从原始数据集中选出m个样本用于训练(原始数据集的样本数量也为m)。
- 使用这m个样本来构建一棵决策树。
- 从所有特征中随机选择K个特征(特征不重复)。
- 根据目标函数的要求(如最大信息增益),使用选定的特征对节点进行划分。
- 重复以上两步n次,即建立n棵决策树。
- 这n棵决策树形成随机森林,通过投票表决结果或均值决定最终的预测值。
关于随机森林,具有如下的说明:
- 用于训练决策树(基本评估器)的数据子集,其样本数量与原始数据集的样本数量相同。
- 默认情况下,随机森林中的决策树在拆分节点时,不再从所有特征中选择最优的特征,而是从随机的特征子集中,选择最优的一个特征。
- 由于这种随机性,随机森林的偏差通常会略微增加(相对于单个非随机决策树的偏差),但由于使用多棵决策树平均预测,其方差也会减小,从而从整体上来讲,模型更加优秀。
- 在分类预测时,scikit-learn中使用概率的平均值进行预测,而不是让每个分类器对单个类别进行投票。
- 对于回归任务,通常设置max_features=n_features,对于分类任务,通常设置max_features=sqrt(n_features)。
- max_depth=None结合min_samples_split=2,通常可以获得很好的结果,但是,这往往会消耗大量的内存。
4.1 随机森林程序(with codes)
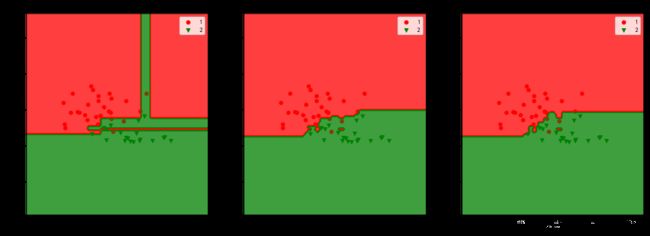
将之前bagging的两个示例,去掉注释,查看随机森林模型在分类与回归问题上的效果。
from sklearn.datasets import make_regression
from sklearn.linear_model import LinearRegression
from sklearn.ensemble import RandomForestRegressor
from sklearn.model_selection import train_test_split

X, y = make_regression(n_samples=1000, noise=10, random_state=0, bias=5.5)
X_train, X_test, y_train, y_test = train_test_split(X, y, test_size=0.3, random_state=0)
lr = LinearRegression()
lr.fit(X_train, y_train)
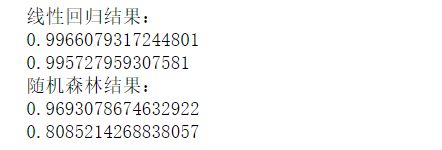
print("线性回归结果:")
print(lr.score(X_train, y_train))
print(lr.score(X_test, y_test))
rf = RandomForestRegressor(n_estimators=100, criterion="mse")
rf.fit(X_train, y_train)
print("随机森林结果:")
print(rf.score(X_train, y_train))
print(rf.score(X_test, y_test))
# 葡萄酒数据集
from sklearn.datasets import load_wine
from sklearn.model_selection import train_test_split
from sklearn.ensemble import BaggingClassifier, RandomForestClassifier
from sklearn.tree import DecisionTreeClassifier

X, y = load_wine(return_X_y=True)
# 为了可视化方便,简化操作,我们只取两个特征。
X = X[:, [0, 10]]
# 我们过滤掉0的类别,只取两个类别。
X = X[y != 0]
y = y[y != 0]
X_train, X_test, y_train, y_test = train_test_split(X, y, test_size=0.4, random_state=0)

tree = DecisionTreeClassifier(criterion="entropy", max_depth=None)
tree = tree.fit(X_train, y_train)
print("决策树分类准确率:")
print(tree.score(X_train, y_train))
print(tree.score(X_test, y_test))
# n_jobs 开辟进程的数量。如果指定-1,则表示利用现有的所有CPU来实现并行化。
bag = BaggingClassifier(base_estimator=tree, n_estimators=100, max_samples=1.0, max_features=1.0,
        bootstrap=True, bootstrap_features=False, n_jobs=-1, random_state=1)
bag = bag.fit(X_train, y_train)
print("bagging准确率:")
print(bag.score(X_train, y_train))
print(bag.score(X_test, y_test))
rf = RandomForestClassifier(n_estimators=100, criterion="gini", random_state=0, max_depth=None)
rf.fit(X_train, y_train)
print("随机森林准确率:")
print(rf.score(X_train, y_train))
print(rf.score(X_test, y_test))
import numpy as np
import matplotlib as mpl
import matplotlib.pyplot as plt
from matplotlib.colors import ListedColormap

mpl.rcParams["font.family"] = "SimHei"
mpl.rcParams["axes.unicode_minus"] = False

cmap = ListedColormap(["r", "g"])
marker = ["o", "v"]
x1_min, x2_min = np.min(X_test, axis=0)
x1_max, x2_max = np.max(X_test, axis=0)
x1 = np.linspace(x1_min - 1, x1_max + 1, 100)
x2 = np.linspace(x2_min - 1, x2_max + 1, 100)
X1, X2 = np.meshgrid(x1, x2)
plt.figure(figsize=(18, 6))
name = ["决策树", "bagging", "随机森林"]
for index, estimator in enumerate([tree, bag, rf], start=1):
    plt.subplot(1, 3, index)
    for i, class_ in enumerate(np.unique(y)):
        Z = estimator.predict(np.array([X1.ravel(), X2.ravel()]).T).reshape(X1.shape)
        plt.contourf(X1, X2, Z, cmap=cmap, alpha=0.5)
        plt.scatter(x=X_test[y_test == class_, 0], y=X_test[y_test == class_, 1],
                c=cmap(i), label=class_, marker=marker[i])
    plt.title(name[index - 1])
    plt.xlabel("色度")
    plt.ylabel("酒精含量")
    plt.legend()
plt.show()
5. boosting
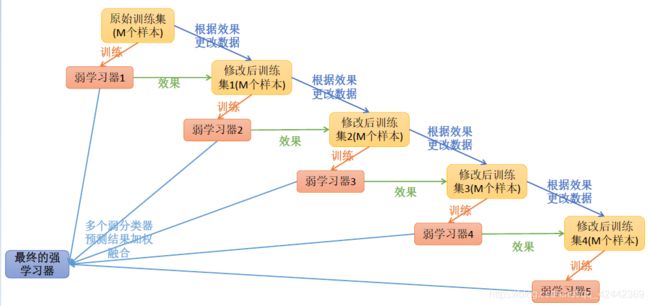
在之前的bagging与随机森林的构建过程中,各个评估器之间没有关系,是相对独立的。例如,在随机森林构建的过程中,构建第m棵子树的时候,不会考虑前面的m-1棵树。
如果在构建过程中,后面的评估器是建立在之前的评估器上的,则就是另外一种集成学习——boosting。
提升学习(Boosting)是一种机器学习技术,可以用于回归和分类的问题,其每一步产生弱预测模型,并加权累加到总模型中。
6. AdaBoost
Adaptive Boosting(AdaBoost)是一种迭代算法。每轮迭代中会在训练集上产生一个新的学习器,然后使用该学习器对所有样本进行预测,以评估每个样本的重要性。
算法会为每个样本赋予一个权重,每次用训练好的学习器标注/预测各个样本,如果某个样本点被预测的越正确,则将其权重降低;否则提高样本的权重。权重越高的样本在下一个迭代训练中所占的比重就越大,也就是说越难区分的样本在训练过程中会变得越重要。整个迭代过程直到错误率足够小或者达到一定的迭代次数为止。
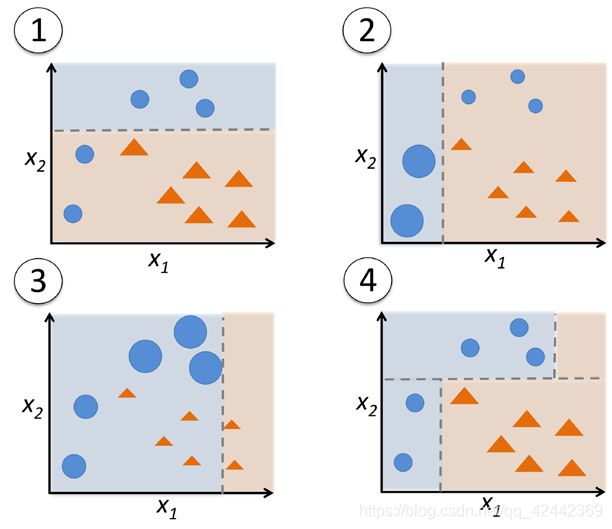
Adaboost算法将基本学习器的线性组合作为强学习器,同时给误差率较小的基本学习器以较大的权重,给误差率较大的基本学习器以较小的权重。构建的线性组合为:
f ( x ) = ∑ i = 1 m α i G i ( x ) f(x) = \sum_{i=1}^{m}\alpha_iG_i(x) f(x)=∑i=1mαiGi(x)
其中, α \alpha α就是每个基本学习器的权重。
对于分类,则在最终的结果上进行sign函数的转换即可:
G ( x ) = s i g n ( f ( x ) ) = s i g n ( ∑ i = 1 m α i G i ( x ) ) G(x) = sign(f(x)) = sign(\sum_{i=1}^{m}\alpha_iG_i(x)) G(x)=sign(f(x))=sign(∑i=1mαiGi(x))
6.1 权重说明
Adaboost算法含有两个权重,一个是样本的权重,一个是评估器(基本的学习器)的权重,不要混淆。
6.2 AdaBoost算法步骤
AdaBoost算法步骤如下(以分类为例):
- 初始化每个样本的权重 w w w,使得所有样本的权重初始值相同,并且权重和为1。
- 在第m轮操作中,使用具有权重 w m w_m wm的样本训练基本学习器 G m ( x ) G_m(x) Gm(x)。
- 使用基本学习器 G m ( x ) G_m(x) Gm(x)预测样本输出值 y ^ \hat{y} y^。
- 计算含有权重的错误率: ϵ m = w m ⋅ ( y ≠ y ^ ) \epsilon_m=w_m \cdot (y \neq \hat{y}) ϵm=wm⋅(y̸=y^)
- 计算基本学习器 G m ( x ) G_m(x) Gm(x)的权重系数: α m = 0.5 ∗ l o g 1 − ϵ m ϵ m \alpha_m=0.5 * log\frac{1-\epsilon_m}{\epsilon_m} αm=0.5∗logϵm1−ϵm
- 更新权重: w m = w m ∗ e − α m ∗ y ∗ y ^ w_m = w_m * e^{-\alpha_m * y * \hat{y}} wm=wm∗e−αm∗y∗y^
- 对权重 w m w_m wm进行归一化,使其和为1: w m = w j / ∑ j w j w_m = w_j / \sum_{j} w_j wm=wj/∑jwj
- 构建基本学习器的线性组合:$f(x) =\sum_{i=1}^{m}\alpha_iG_i(x) $
- 重复步骤2 ~ 8若干次,获得最终的学习器: G ( x ) = s i g n ( f ( x ) ) = s i g n ( ∑ i = 1 m α i G i ( x ) ) G(x) = sign(f(x)) = sign(\sum_{i=1}^{m}\alpha_iG_i(x)) G(x)=sign(f(x))=sign(∑i=1mαiGi(x))
6.3 AdaBoost示例
假设给定的数据集,如下:
| X | 0 | 1 | 2 | 3 | 4 | 5 | 6 | 7 | 8 | 9 |
|---|---|---|---|---|---|---|---|---|---|---|
| y | 1 | 1 | 1 | -1 | -1 | -1 | 1 | 1 | 1 | -1 |
我们假设基本学习器使用决策树,并且不存度衡量标准使用信息熵。
第1轮
在初始状态,所有样本的权值w相同,且和为1。
| X | 0 | 1 | 2 | 3 | 4 | 5 | 6 | 7 | 8 | 9 |
|---|---|---|---|---|---|---|---|---|---|---|
| y | 1 | 1 | 1 | -1 | -1 | -1 | 1 | 1 | 1 | -1 |
| w 1 w_1 w1 | 0.1 | 0.1 | 0.1 | 0.1 | 0.1 | 0.1 | 0.1 | 0.1 | 0.1 | 0.1 |
训练学习器
分割点可以为2.5、5.5与8.5。
G 1 ( x ) = { 1 x < 2.5 − 1 x > 2.5 G_1(x) = \left\{\begin{matrix} 1 & x < 2.5\\ -1 & x > 2.5 \end{matrix}\right. G1(x)={1−1x<2.5x>2.5
预测输出值
使用训练好的学习器对样本进行预测:
| X | 0 | 1 | 2 | 3 | 4 | 5 | 6 | 7 | 8 | 9 |
|---|---|---|---|---|---|---|---|---|---|---|
| y | 1 | 1 | 1 | -1 | -1 | -1 | 1 | 1 | 1 | -1 |
| w 1 w_1 w1 | 0.1 | 0.1 | 0.1 | 0.1 | 0.1 | 0.1 | 0.1 | 0.1 | 0.1 | 0.1 |
| G1(x)- y ^ \hat{y} y^ | 1 | 1 | 1 | -1 | -1 | -1 | -1 | -1 | -1 | -1 |
计算错误率
ϵ 1 = w 1 ⋅ ( y ≠ y ^ ) = 0.3 \epsilon_1=w_1 \cdot (y \neq \hat{y}) = 0.3 ϵ1=w1⋅(y̸=y^)=0.3
计算权重系数
α 1 = 0.5 ∗ l o g 1 − ϵ 1 ϵ 1 ≈ 0.424 \alpha_1=0.5 * log\frac{1-\epsilon_1}{\epsilon_1} \approx 0.424 α1=0.5∗logϵ11−ϵ1≈0.424
更新权重
w 1 = w 1 ∗ e − α 1 ∗ y ∗ y ^ w_1 = w_1 * e^{-\alpha_1 * y * \hat{y}} w1=w1∗e−α1∗y∗y^
如果预测正确,则 y y y与 y ^ \hat{y} y^符号相同,二者的乘积为正,否则,二者的乘积为负。而 α \alpha α的值大于0,因此,预测正确时,权重降低,预测错误时,权重提高。
因此,降低后的权重为:
0.1 ∗ e − α 1 ≈ 0.065 0.1 * e^{-\alpha_1} \approx 0.065 0.1∗e−α1≈0.065
提高后的权重为:
0.1 ∗ e α 1 ≈ 0.153 0.1 * e^{\alpha_1} \approx 0.153 0.1∗eα1≈0.153
更新后的结果如下:
| X | 0 | 1 | 2 | 3 | 4 | 5 | 6 | 7 | 8 | 9 |
|---|---|---|---|---|---|---|---|---|---|---|
| y | 1 | 1 | 1 | -1 | -1 | -1 | 1 | 1 | 1 | -1 |
| w 1 w_1 w1 | 0.065 | 0.065 | 0.065 | 0.065 | 0.065 | 0.065 | 0.153 | 0.153 | 0.153 | 0.065 |
| G1(x)- y ^ \hat{y} y^ | 1 | 1 | 1 | -1 | -1 | -1 | -1 | -1 | -1 | -1 |
权重归一化
w m = w j / ∑ j w j w_m = w_j / \sum_{j} w_j wm=wj/∑jwj
∑ j w j = 7 ∗ 0.065 + 3 ∗ 0.153 = 0.914 \sum_{j} w_j = 7 * 0.065 + 3 * 0.153 = 0.914 ∑jwj=7∗0.065+3∗0.153=0.914,因此,归一化的结果为:
预测正确的样本: 0.065 / 0.914 ≈ 0.071 0.065 / 0.914 \approx 0.071 0.065/0.914≈0.071
预测错误的样本: 0.153 / 0.914 ≈ 0.167 0.153 / 0.914 \approx 0.167 0.153/0.914≈0.167
| X | 0 | 1 | 2 | 3 | 4 | 5 | 6 | 7 | 8 | 9 |
|---|---|---|---|---|---|---|---|---|---|---|
| y | 1 | 1 | 1 | -1 | -1 | -1 | 1 | 1 | 1 | -1 |
| w 1 w_1 w1 | 0.071 | 0.071 | 0.071 | 0.071 | 0.071 | 0.071 | 0.167 | 0.167 | 0.167 | 0.071 |
| G1(x)- y ^ \hat{y} y^ | 1 | 1 | 1 | -1 | -1 | -1 | -1 | -1 | -1 | -1 |
线性组合
经过第1轮后,学习器的线性组合为:
f 1 ( x ) = 0.424 ∗ G 1 ( x ) f_1(x) = 0.424 * G_1(x) f1(x)=0.424∗G1(x)
| X | 0 | 1 | 2 | 3 | 4 | 5 | 6 | 7 | 8 | 9 |
|---|---|---|---|---|---|---|---|---|---|---|
| y | 1 | 1 | 1 | -1 | -1 | -1 | 1 | 1 | 1 | -1 |
| w 1 w_1 w1 | 0.071 | 0.071 | 0.071 | 0.071 | 0.071 | 0.071 | 0.167 | 0.167 | 0.167 | 0.071 |
| G1(x)- y ^ \hat{y} y^ | 1 | 1 | 1 | -1 | -1 | -1 | -1 | -1 | -1 | -1 |
| G- y ^ \hat{y} y^ | 1 | 1 | 1 | -1 | -1 | -1 | -1 | -1 | -1 | -1 |
第2轮
在第2轮初始时,数据如下:
| X | 0 | 1 | 2 | 3 | 4 | 5 | 6 | 7 | 8 | 9 |
|---|---|---|---|---|---|---|---|---|---|---|
| y | 1 | 1 | 1 | -1 | -1 | -1 | 1 | 1 | 1 | -1 |
| w 2 w_2 w2 | 0.071 | 0.071 | 0.071 | 0.071 | 0.071 | 0.071 | 0.167 | 0.167 | 0.167 | 0.071 |
训练学习器
$
prop_1(D_p) = 0.071 * 3 + 0.167 * 3 = 0.714 \
prop_{-1}(D_p) = 1 - 0.714 = 0.286 \
I_H(D_p) = -(0.714 * log_20.714 + 0.286 * log_20.286) = 0.863 \
I_H(D_{x < 2.5}) = 0 \
prop_1((x >=2.5) = (0.167 * 3) / (0.071 * 4 + 0.167 * 3) = 0.638 \
prop_{-1}(x >= 2.5) = 1 - 0.638 = 0.362 \
I_H(D_{x >= 2.5}) = -(0.638 * log_20.638 + 0.362 * log_20.362) = 0.944 \
prop(x < 2.5) = 0.071 * 3 = 0.213 \
prop(x >= 2.5) = 1 - 0.213 = 0.787 \
IG_H(x=2.5) = 0.863 - 0.213 * 0 - 0.787 * 0.944 = 0.120
$
$
I_H(D_{x < 5.5}) = 1 \
prop_1((x >=5.5) = (0.167 * 3) / (0.071 * 1 + 0.167 * 3) = 0.876 \
prop_{-1}(x >= 5.5) = 1 - 0.876 = 0.124 \
I_H(D_{x >= 5.5}) = -(0.876 * log_20.876 + 0.124 * log_20.124) = 0.541 \
prop(x < 5.5) = 0.071 * 6 = 0.426 \
prop(x >= 5.5) = 1 - 0.213 = 0.574 \
IG_H(x=5.5) = 0.863 - 0.426 * 1 - 0.574 * 0.541 = 0.126
$
$
prop_1((x < 8.5) = (0.071 * 3 + 0.167 * 3) / (0.071 * 6 + 0.167 * 3) = 0.770 \
prop_{-1}(x < 8.5) = 1 - 0.770 = 0.230 \
I_H(D_{x < 8.5}) = -(0.770 * log_20.770 + 0.230 * log_20.230) = 0.778 \
I_H(D_{x >= 8.5}) = 0 \
prop(x < 8.5) = 0.071 * 6 + 0.167 * 3 = 0.927 \
prop(x >= 8.5) = 1 - 0.927 = 0.073 \
IG_H(x=8.5) = 0.863 - 0.927 * 0.770 - 0.073 * 0 = 0.149
$
G 2 ( x ) = { 1 x < 8.5 − 1 x > 8.5 G_2(x) = \left\{\begin{matrix} 1 & x < 8.5\\ -1 & x > 8.5 \end{matrix}\right. G2(x)={1−1x<8.5x>8.5
预测输出值
使用训练好的学习器对样本进行预测:
| X | 0 | 1 | 2 | 3 | 4 | 5 | 6 | 7 | 8 | 9 |
|---|---|---|---|---|---|---|---|---|---|---|
| y | 1 | 1 | 1 | -1 | -1 | -1 | 1 | 1 | 1 | -1 |
| w 2 w_2 w2 | 0.071 | 0.071 | 0.071 | 0.071 | 0.071 | 0.071 | 0.167 | 0.167 | 0.167 | 0.071 |
| G2(x)- y ^ \hat{y} y^ | 1 | 1 | 1 | 1 | 1 | 1 | 1 | 1 | 1 | -1 |
计算错误率
ϵ 2 = w 2 ⋅ ( y ≠ y ^ ) = 0.071 ∗ 3 = 0.213 \epsilon_2=w_2 \cdot (y \neq \hat{y}) = 0.071 * 3 = 0.213 ϵ2=w2⋅(y̸=y^)=0.071∗3=0.213
计算权重系数
α 2 = 0.5 ∗ l o g 1 − ϵ 2 ϵ 2 ≈ 0.653 \alpha_2=0.5 * log\frac{1-\epsilon_2}{\epsilon_2} \approx 0.653 α2=0.5∗logϵ21−ϵ2≈0.653
更新权重
w 2 = w 2 ∗ e − α 2 ∗ y ∗ y ^ w_2 = w_2 * e^{-\alpha_2 * y * \hat{y}} w2=w2∗e−α2∗y∗y^
更新后的结果如下:
| X | 0 | 1 | 2 | 3 | 4 | 5 | 6 | 7 | 8 | 9 |
|---|---|---|---|---|---|---|---|---|---|---|
| y | 1 | 1 | 1 | -1 | -1 | -1 | 1 | 1 | 1 | -1 |
| w 2 w_2 w2 | 0.037 | 0.037 | 0.037 | 0.136 | 0.136 | 0.136 | 0.087 | 0.087 | 0.087 | 0.037 |
| G2(x)- y ^ \hat{y} y^ | 1 | 1 | 1 | 1 | 1 | 1 | 1 | 1 | 1 | -1 |
权重归一化
w m = w j / ∑ j w j w_m = w_j / \sum_{j} w_j wm=wj/∑jwj
∑ j w j = 0.037 ∗ 4 + 0.136 ∗ 3 + 0.087 ∗ 3 = 0.818 \sum_{j} w_j = 0.037 * 4 + 0.136 * 3 + 0.087 * 3 = 0.818 ∑jwj=0.037∗4+0.136∗3+0.087∗3=0.818
因此,归一化的结果为:
| X | 0 | 1 | 2 | 3 | 4 | 5 | 6 | 7 | 8 | 9 |
|---|---|---|---|---|---|---|---|---|---|---|
| y | 1 | 1 | 1 | -1 | -1 | -1 | 1 | 1 | 1 | -1 |
| w 2 w_2 w2 | 0.045 | 0.045 | 0.045 | 0.167 | 0.167 | 0.167 | 0.106 | 0.106 | 0.106 | 0.045 |
| G2(x)- y ^ \hat{y} y^ | 1 | 1 | 1 | 1 | 1 | 1 | 1 | 1 | 1 | -1 |
线性组合
经过第2轮后,学习器的线性组合为:
f 2 ( x ) = 0.424 ∗ G 1 ( x ) + 0.653 ∗ G 2 ( x ) f_2(x) = 0.424 * G_1(x) + 0.653 * G_2(x) f2(x)=0.424∗G1(x)+0.653∗G2(x)
| X | 0 | 1 | 2 | 3 | 4 | 5 | 6 | 7 | 8 | 9 |
|---|---|---|---|---|---|---|---|---|---|---|
| y | 1 | 1 | 1 | -1 | -1 | -1 | 1 | 1 | 1 | -1 |
| w 2 w_2 w2 | 0.045 | 0.045 | 0.045 | 0.167 | 0.167 | 0.167 | 0.106 | 0.106 | 0.106 | 0.045 |
| G1(x)- y ^ \hat{y} y^ | 1 | 1 | 1 | -1 | -1 | -1 | -1 | -1 | -1 | -1 |
| G2(x)- y ^ \hat{y} y^ | 1 | 1 | 1 | 1 | 1 | 1 | 1 | 1 | 1 | -1 |
| G- y ^ \hat{y} y^ | 1 | 1 | 1 | 1 | 1 | 1 | 1 | 1 | 1 | -1 |
第3轮
在第3轮初始时,数据如下:
| X | 0 | 1 | 2 | 3 | 4 | 5 | 6 | 7 | 8 | 9 |
|---|---|---|---|---|---|---|---|---|---|---|
| y | 1 | 1 | 1 | -1 | -1 | -1 | 1 | 1 | 1 | -1 |
| w 3 w_3 w3 | 0.045 | 0.045 | 0.045 | 0.167 | 0.167 | 0.167 | 0.106 | 0.106 | 0.106 | 0.045 |
训练学习器
$prop_1(D_p) = 0.045 * 3 + 0.106 * 3 = 0.453 \
prop_{-1}(D_p) = 1 - 0.453 = 0.547 \
I_H(D_p) = -(0.453 * log_20.453 + 0.547 * log_20.547) = 0.994 \
I_H(D_{x < 2.5}) = 0 \
prop_1((x >=2.5) = (0.106 * 3) / (0.106 * 3 + 0.167 * 3 + 0.045) = 0.368 \
prop_{-1}(x >= 2.5) = 1 - 0.368 = 0.632 \
I_H(D_{x >= 2.5}) = -(0.368 * log_20.368 + 0.632 * log_20.632) = 0.949 \
prop(x < 2.5) = 0.045 * 3 = 0.135 \
prop(x >= 2.5) = 1 - 0.135 = 0.865 \
IG_H(x=2.5) = 0.994 - 0.135 * 0 - 0.865 * 0.949 = 0.173
$
$
prop_1((x < 5.5) = (0.045 * 3) / (0.045 * 3 + 0.167 * 3) = 0.212 \
prop_{-1}(x < 5.5) = 1 - 0.212 = 0.788 \
I_H(D_{x < 5.5}) = -(0.212 * log_20.212 + 0.788 * log_20.788) = 0.745 \
prop_1((x >=5.5) = (0.106 * 3) / (0.106 * 3 + 0.045 * 1) = 0.876 \
prop_{-1}(x >= 5.5) = 1 - 0.876 = 0.124 \
I_H(D_{x >= 5.5}) = -(0.876 * log_20.876 + 0.124 * log_20.124) = 0.541 \
prop(x < 5.5) = 0.045 * 3 + 0.167 * 3 = 0.636 \
prop(x >= 5.5) = 1 - 0.636 = 0.364 \
IG_H(x=5.5) = 0.994 - 0.636 * 0.745 - 0.364 * 0.541 = 0.323
$
$
prop_1((x < 8.5) = (0.045 * 3 + 0.106 * 3) / (0.045 * 3 + 0.106 * 3 + 0.167 * 3) = 0.475 \
prop_{-1}(x < 8.5) = 1 - 0.475 = 0.525 \
I_H(D_{x < 8.5}) = -(0.475 * log_20.475 + 0.525 * log_20.525) = 0.998 \
I_H(D_{x >= 8.5}) = 0 \
prop(x < 8.5) = 0.045 * 3 + 0.106 * 3 + 0.167 * 3 = 0.954 \
prop(x >= 8.5) = 1 - 0.954 = 0.046 \
IG_H(x=8.5) = 0.994 - 0.954 * 0.998 - 0.046 * 0 = 0.042
$
G 3 ( x ) = { 1 x < 5.5 − 1 x > 5.5 G_3(x) = \left\{\begin{matrix} 1 & x < 5.5\\ -1 & x > 5.5 \end{matrix}\right. G3(x)={1−1x<5.5x>5.5
预测输出值
如果按照之前的方式进行预测,则错误率大于0.5,因此,我们按照相反的方式进行预测,即:
G 3 ( x ) = { 1 x > 5.5 − 1 x < 5.5 G_3(x) = \left\{\begin{matrix} 1 & x > 5.5\\ -1 & x < 5.5 \end{matrix}\right. G3(x)={1−1x>5.5x<5.5
使用训练好的学习器对样本进行预测:
| X | 0 | 1 | 2 | 3 | 4 | 5 | 6 | 7 | 8 | 9 |
|---|---|---|---|---|---|---|---|---|---|---|
| y | 1 | 1 | 1 | -1 | -1 | -1 | 1 | 1 | 1 | -1 |
| w 3 w_3 w3 | 0.045 | 0.045 | 0.045 | 0.167 | 0.167 | 0.167 | 0.106 | 0.106 | 0.106 | 0.045 |
| G3(x)- y ^ \hat{y} y^ | -1 | -1 | -1 | -1 | -1 | -1 | 1 | 1 | 1 | 1 |
计算错误率
ϵ 3 = w 3 ⋅ ( y ≠ y ^ ) = 0.045 ∗ 4 = 0.180 \epsilon_3=w_3 \cdot (y \neq \hat{y}) = 0.045 * 4 = 0.180 ϵ3=w3⋅(y̸=y^)=0.045∗4=0.180
计算权重系数
α 3 = 0.5 ∗ l o g 1 − ϵ 3 ϵ 3 ≈ 0.758 \alpha_3=0.5 * log\frac{1-\epsilon_3}{\epsilon_3} \approx 0.758 α3=0.5∗logϵ31−ϵ3≈0.758
更新权重
w 3 = w 3 ∗ e − α 3 ∗ y ∗ y ^ w_3 = w_3 * e^{-\alpha_3 * y * \hat{y}} w3=w3∗e−α3∗y∗y^
更新后的结果如下:
| X | 0 | 1 | 2 | 3 | 4 | 5 | 6 | 7 | 8 | 9 |
|---|---|---|---|---|---|---|---|---|---|---|
| y | 1 | 1 | 1 | -1 | -1 | -1 | 1 | 1 | 1 | -1 |
| w 3 w_3 w3 | 0.152 | 0.152 | 0.152 | 0.033 | 0.033 | 0.033 | 0.078 | 0.078 | 0.078 | 0.152 |
| G3(x)- y ^ \hat{y} y^ | -1 | -1 | -1 | -1 | -1 | -1 | 1 | 1 | 1 | 1 |
权重归一化
w m = w j / ∑ j w j w_m = w_j / \sum_{j} w_j wm=wj/∑jwj
∑ j w j = 0.152 ∗ 4 + 0.033 ∗ 3 + 0.078 ∗ 3 = 0.941 \sum_{j} w_j = 0.152 * 4 + 0.033 * 3 + 0.078 * 3 = 0.941 ∑jwj=0.152∗4+0.033∗3+0.078∗3=0.941
因此,归一化的结果为:
| X | 0 | 1 | 2 | 3 | 4 | 5 | 6 | 7 | 8 | 9 |
|---|---|---|---|---|---|---|---|---|---|---|
| y | 1 | 1 | 1 | -1 | -1 | -1 | 1 | 1 | 1 | -1 |
| w 3 w_3 w3 | 0.152 | 0.152 | 0.152 | 0.033 | 0.033 | 0.033 | 0.078 | 0.078 | 0.078 | 0.152 |
| G3(x)- y ^ \hat{y} y^ | -1 | -1 | -1 | -1 | -1 | -1 | 1 | 1 | 1 | 1 |
线性组合
经过第3轮后,学习器的线性组合为:
f 3 ( x ) = 0.424 ∗ G 1 ( x ) + 0.653 ∗ G 2 ( x ) + 0.758 ∗ G 3 ( x ) f_3(x) = 0.424 * G_1(x) + 0.653 * G_2(x) + 0.758 * G_3(x) f3(x)=0.424∗G1(x)+0.653∗G2(x)+0.758∗G3(x)
| X | 0 | 1 | 2 | 3 | 4 | 5 | 6 | 7 | 8 | 9 |
|---|---|---|---|---|---|---|---|---|---|---|
| y | 1 | 1 | 1 | -1 | -1 | -1 | 1 | 1 | 1 | -1 |
| w 3 w_3 w3 | 0.152 | 0.152 | 0.152 | 0.033 | 0.033 | 0.033 | 0.078 | 0.078 | 0.078 | 0.152 |
| G1(x)- y ^ \hat{y} y^ | 1 | 1 | 1 | -1 | -1 | -1 | -1 | -1 | -1 | -1 |
| G2(x)- y ^ \hat{y} y^ | 1 | 1 | 1 | 1 | 1 | 1 | 1 | 1 | 1 | -1 |
| G3(x)- y ^ \hat{y} y^ | -1 | -1 | -1 | -1 | -1 | -1 | 1 | 1 | 1 | 1 |
| G- y ^ \hat{y} y^ | 1 | 1 | 1 | -1 | -1 | -1 | 1 | 1 | 1 | -1 |
import numpy as np
import matplotlib.pyplot as plt
from sklearn.tree import DecisionTreeRegressor
# AdaBoostRegressor sklearn中提供的关于AdaBoost回归的模型。
from sklearn.ensemble import AdaBoostRegressor

rng = np.random.RandomState(1)
X = np.linspace(0, 6, 100)[:, np.newaxis]
y = np.sin(X).ravel() + np.sin(6 * X).ravel() + rng.normal(0, 0.1, X.shape[0])


regr_1 = DecisionTreeRegressor(max_depth=4)

regr_2 = AdaBoostRegressor(DecisionTreeRegressor(max_depth=4),
                          n_estimators=50, random_state=rng)
regr_3 = AdaBoostRegressor(DecisionTreeRegressor(max_depth=4),
                          n_estimators=300, random_state=rng)

regr_1.fit(X, y)
regr_2.fit(X, y)
regr_3.fit(X, y)
y_1 = regr_1.predict(X)
y_2 = regr_2.predict(X)
y_3 = regr_3.predict(X)

plt.figure(figsize=(18, 6))
plt.scatter(X, y, c="k", label="训练样本")
plt.plot(X, y_1, c="r", label="n_estimators=1")
plt.plot(X, y_2, c="g", label="n_estimators=50")
plt.plot(X, y_3, c="b", label="n_estimators=300")
plt.xlabel("数据")
plt.ylabel("值")
plt.title("Boosted Decision Tree Regression")
plt.legend()
plt.show()
