Python统计分析之HR如何更快察觉员工的潜在离职因素
前言:
大数据使企业能够确定变量,预测自家公司的员工离职率。” ——《哈佛商业评论》2017年8月
“员工流失分析就是评估公司员工流动率的过程,目的是预测未来的员工离职状况,减少员工流失情况。” ——《福布斯》2016年3月
一、背景介绍
1. 数据来源
本项目数据集来自DataCastle训练赛。
数据及代码链接:链接:https://pan.baidu.com/s/1–beIhOAQNqo7KYpuX69ZA 密码:ca1s
2. 数据说明
比赛所用到的数据取自于IBM Watson Analytics分析平台分享的样例数据。我们只选取了其中的子集,并对数据做了一些预处理使数据更加符合逻辑回归分析模型的要求。
数据主要包括影响员工离职的各种因素(工资、出差、工作环境满意度、工作投入度、是否加班、是否升职、工资提升比例等)以及员工是否已经离职的对应记录。 数据分为训练数据和测试数据,分别保存在pfm_train.csv和pfm_test.csv两个文件中。
| 字段名称 | 字段说明 |
|---|---|
| Age | 员工年龄 |
| Attrition | 员工是否已经离职,1表示已经离职,0表示未离职,这是目标预测值 |
| BusinessTravel | 商务差旅频率,Non-Travel表示不出差,Travel_Rarely表示不经常出差,Travel_Frequently表示经常出差 |
| Department | 员工所在部门,Sales表示销售部,Research & Development表示研发部,Human Resources表示人力资源部 |
| DistanceFromHome | 公司跟家庭住址的距离,从1到29,1表示最近,29表示最远 |
| Education | 员工的教育程度,从1到5,5表示教育程度最高 |
| EducationField | 员工所学习的专业领域,Life Sciences表示生命科学,Medical表示医疗,Marketing表示市场营销,Technical Degree表示技术学位,Human Resources表示人力资源,Other表示其他 |
| EmployeeNumber | 员工号码 |
| EnviromentSatisfaction | 员工对于工作环境的满意程度,从1到4,1的满意程度最低,4的满意程度最高 |
| Gender | 员工性别,Male表示男性,Female表示女性 |
| JobInvolvement | 员工工作投入度,从1到4,1为投入度最低,4为投入度最高 |
| JobLevel | 职业级别,从1到5,1为最低级别,5为最高级别 |
| JobRole | 工作角色:Sales Executive是销售主管,Research Scientist是科学研究员,Laboratory Technician实验室技术员,Manufacturing Director是制造总监,Healthcare Representative是医疗代表,Manager是经理,Sales Representative是销售代表,Research Director是研究总监,Human Resources是人力资源 |
| JobSatisfaction | 工作满意度,从1到4,1代表满意程度最低,4代表满意程度最高 |
| MaritalStatus | 员工婚姻状况,Single代表单身,Married代表已婚,Divorced代表离婚 |
| MonthlyIncome | 员工月收入,范围在1009到19999之间 |
| NumCompaniesWorked | 员工曾经工作过的公司数 |
| Over18 | 年龄是否超过18岁 |
| OverTime | 是否加班,Yes表示加班,No表示不加班 |
| PercentSalaryHike | 工资提高的百分比 |
| PerformanceRating | 绩效评估 |
| RelationshipSatisfaction | 关系满意度,从1到4,1表示满意度最低,4表示满意度最高 |
| StandardHours | 标准工时 |
| StockOptionLevel | 股票期权水平 |
| TotalWorkingYears | 总工龄 |
| TrainingTimesLastYear | 上一年的培训时长,从0到6,0表示没有培训,6表示培训时间最长 |
| WorkLifeBalance | 工作与生活平衡程度,从1到4,1表示平衡程度最低,4表示平衡程度最高 |
| YearsAtCompany | 在目前公司工作年数 |
| YearsInCurrentRole | 在目前工作职责的工作年数 |
| YearsSinceLastPromotion | 距离上次升职时长 |
| YearsWithCurrManager | 跟目前的管理者共事年数 |
3. 分析目的
测试数据主要包括350条记录,30个字段,跟训练数据的不同是测试数据并不包括员工是否已经离职的记录,学员需要通过由训练数据所建立的模型以及所给的测试数据,得出测试数据相应的员工是否已经离职的预测。
二、数据探索性分析
1. 数据读取
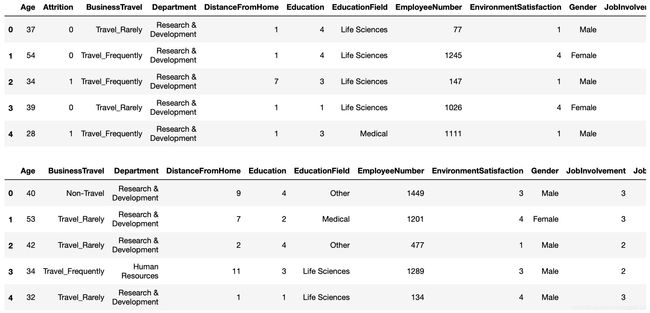
pd.set_option('max_columns',50)
train = pd.read_csv('pfm_train.csv')
train.head()
test = pd.read_csv('pfm_test.csv')
test.head()
2. 数据信息探索
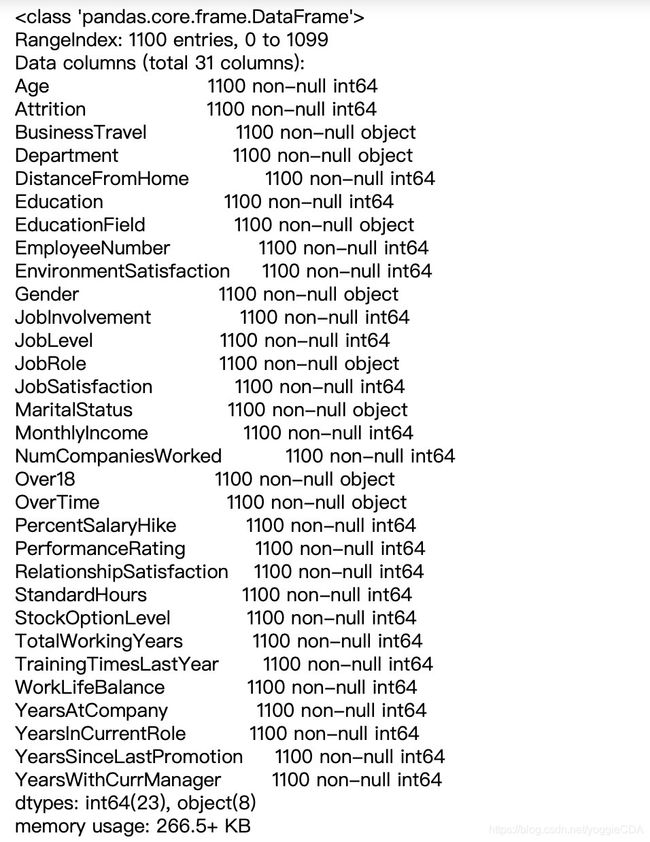
train.info()
3. 删除无用特征
train['Over18'].value_counts() # 只包含一种属性

train = train.drop(['EmployeeNumber','Over18'],axis=1) # 删除无用特征
4. 描述性统计
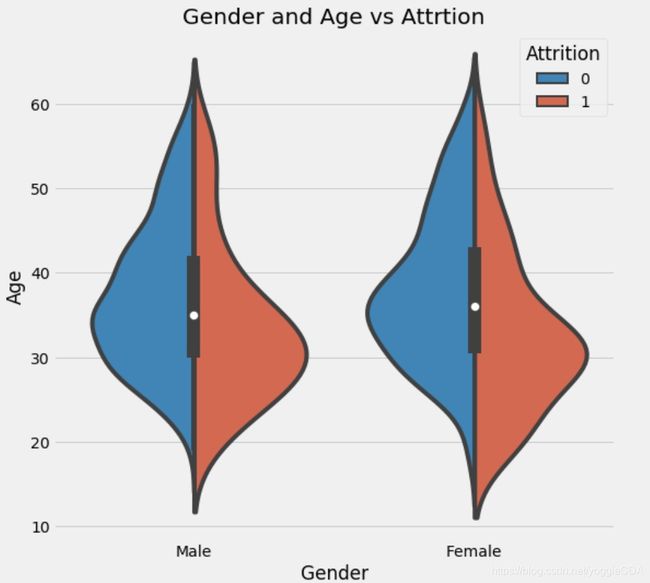
4.1 年龄、性别与是否离职关系图
f,ax=plt.subplots(1,2,figsize=(18,8))
sns.violinplot("Gender","Age", hue="Attrition", data=train,split=True,ax=ax[0])
ax[0].set_title('Gender and Age vs Attrtion');
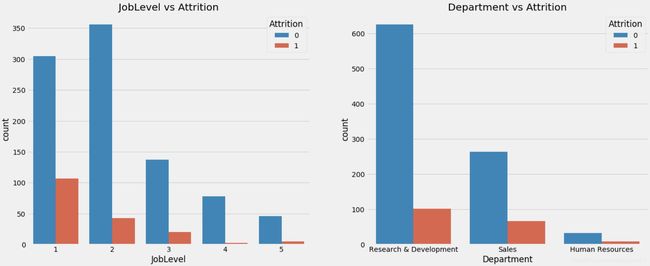
4.2 工作水平、部门与是否离职关系图
f,ax=plt.subplots(1,2,figsize=(20,8))
sns.countplot('JobLevel',hue='Attrition',data=train,ax=ax[0])
ax[0].set_title('JobLevel vs Attrition')
sns.countplot('Department',hue='Attrition',data=train,ax=ax[1])
ax[1].set_title('Department vs Attrition');
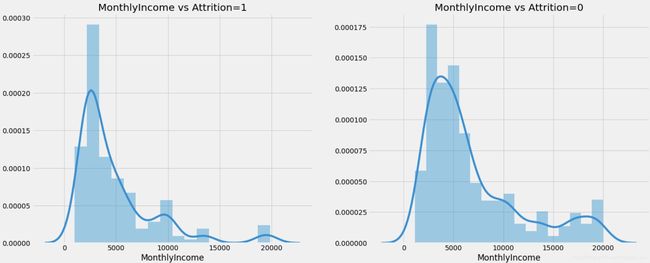
4.3 月收入与离职情况关系图
f,ax=plt.subplots(1,2,figsize=(20,8))
sns.distplot(train[train['Attrition']==1].MonthlyIncome,ax=ax[0])
ax[0].set_title('MonthlyIncome vs Attrition=1')
sns.distplot(train[train['Attrition']==0].MonthlyIncome,ax=ax[1])
ax[1].set_title('MonthlyIncome vs Attrition=0');
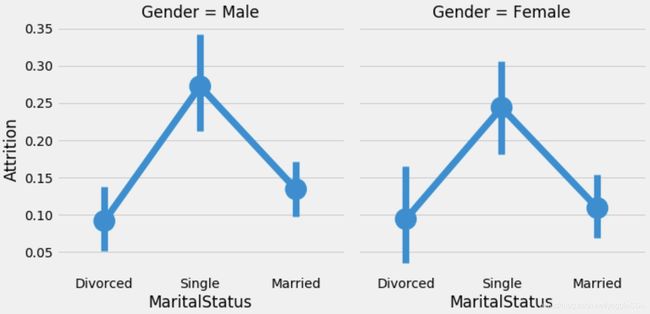
4.4 婚姻状况、性别与是否离职关系图
sns.factorplot('MaritalStatus','Attrition',data=train,col='Gender');
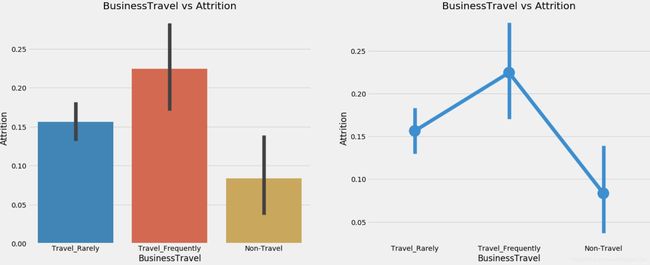
4.5 出差情况与是否离职关系图
f,ax=plt.subplots(1,2,figsize=(20,8))
sns.barplot('BusinessTravel','Attrition',data=train,ax=ax[0])
ax[0].set_title('BusinessTravel vs Attrition')
sns.factorplot('BusinessTravel','Attrition',data=train,ax=ax[1])
ax[1].set_title('BusinessTravel vs Attrition')
plt.close(2);
综上图可以看出,离职人员特征包括偏年轻化,男性稍多,单身,月收入较低,加班等。
三、数据预处理
1. 字符型变量数值化
sklearn只允许数值类型变量进入模型学,所以需要提前将字符型变量数值化,为后续建模做准备。
# 筛选出字符型的变量
col = []
for i in train.columns:
    if train.loc[:,i].dtype=='object':
        col.append(i)

# 导入相关模块进行数据类型转换
from sklearn.preprocessing import OrdinalEncoder
train.loc[:,col] = OrdinalEncoder().fit_transform(train.loc[:,col])
train.loc[:,col].head()
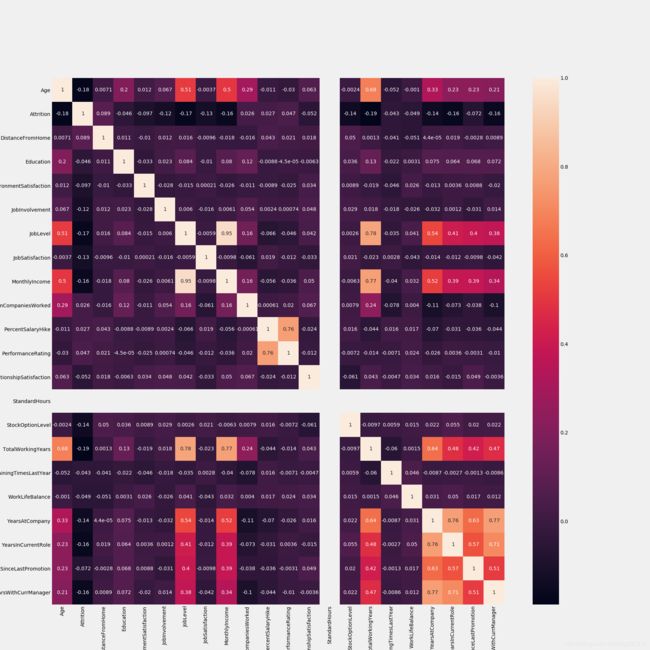
2. 相关性检验
逻辑回归属于广义线性回归,对自变量间的独立性有所要求,所以在这里我们使用皮尔逊相关系数对自变量进行相关性检验,对相关性较高的特征进行进一步筛选。
sns.heatmap(train.corr(),annot=True) #train.corr()-->correlation matrix
fig=plt.gcf()
fig.set_size_inches(20,20);
其中月收入与职位级别相关性呈强正相关关系,在这里我们保留职位级别,将月收入自变量删除。
3. 分类变量独热编码
为什么使用独热编码?
将离散特征通过one-hot编码映射到欧式空间,是因为,在回归,分类,聚类等机器学习算法中,特征之间距离的计算或相似度的计算是非常重要的,而我们常用的距离或相似度的计算都是在欧式空间的相似度计算,计算余弦相似性,基于的就是欧式空间。
使用独热编码的优缺点?
- 优点:独热编码解决了分类器不好处理属性数据的问题,在一定程度上也起到了扩充特征的作用。它的值只有0和1,不同的类型存储在垂直的空间。
- 缺点:当类别的数量很多时,特征空间会变得非常大。在这种情况下,一般可以用PCA来减少维度。而且one hot encoding+PCA这种组合在实际中也非常有用。
X = train.loc[:,train.columns!='Attrition']
Y = train.loc[:,'Attrition']

X_onehot = X.drop(['Age','NumCompaniesWorked','PercentSalaryHike','TotalWorkingYears','YearsAtCompany','YearsInCurrentRole',
                   'YearsSinceLastPromotion', 'YearsWithCurrManager'],axis=1)

from sklearn.preprocessing import OneHotEncoder
X_onehot = OneHotEncoder().fit_transform(X_onehot)
X_onehot = X_onehot.toarray()

X_other = X.loc[:,['Age','NumCompaniesWorked','PercentSalaryHike','TotalWorkingYears','YearsAtCompany','YearsInCurrentRole',
                   'YearsSinceLastPromotion', 'YearsWithCurrManager']]
X_other.shape
X = pd.concat([pd.DataFrame(X_onehot),X_other],axis=1)
X.shape
四、模型学习
1. 划分训练集和验证集
from sklearn.model_selection import train_test_split
Xtrain,Xtest,Ytrain,Ytest = train_test_split(X,Y,test_size=0.2,random_state=42)
Xtrain.shape
2. 逻辑回归模型构建
from sklearn.linear_model import LogisticRegression
LR = LogisticRegression().fit(Xtrain,Ytrain)
LR.score(Xtest,Ytest)
初步模型结果为0.84,还需待进一步调参。
3. 模型评估
from sklearn.metrics import recall_score
recall_score(Ytest,LR.predict(Xtest))
1类样本召回率略低,只有0.42。可以考虑是否要做样本不均衡性处理。
五、模型调参
from sklearn.model_selection import GridSearchCV
params = {'penalty':['l1','l2'],
         'C':np.arange(1,10,0.1)}
gd = GridSearchCV(LogisticRegression(solver='liblinear'),param_grid=params,cv=10)
gd.fit(Xtrain,Ytrain)
print(gd.best_score_)
print(gd.best_params_)

LR_o = LogisticRegression(penalty='l1',C=1.2000000000000002).fit(Xtrain,Ytrain)
LR_o.score(Xtest,Ytest)
调参结果不错,训练集准确率提升到了0.88,验证集准确率也达到了0.85.
六、预测分析
模型建立完成之后,就需要读入测试集并进行预测。这里注意,需要对测试集按照训练集进行相同处理:包括删除变量、转换数据类型、独热编码等操作。
test = test.drop(['EmployeeNumber','Over18','MonthlyIncome'],axis=1)

# 筛选出字符型的变量
col = []
for i in test.columns:
    if test.loc[:,i].dtype=='object':
        col.append(i)

from sklearn.preprocessing import OrdinalEncoder
test.loc[:,col] = OrdinalEncoder().fit_transform(test.loc[:,col])
test.loc[:,col].head()


test_onehot = test.drop(['Age','NumCompaniesWorked','PercentSalaryHike','TotalWorkingYears','YearsAtCompany','YearsInCurrentRole',
                   'YearsSinceLastPromotion', 'YearsWithCurrManager'],axis=1)

from sklearn.preprocessing import OneHotEncoder
test_onehot = OneHotEncoder().fit_transform(test_onehot)
test_onehot = test_onehot.toarray()

test_other = test.loc[:,['Age','NumCompaniesWorked','PercentSalaryHike','TotalWorkingYears','YearsAtCompany','YearsInCurrentRole',
                   'YearsSinceLastPromotion', 'YearsWithCurrManager']]
test_other.shape
X = pd.concat([pd.DataFrame(test_onehot),test_other],axis=1)
X.shape

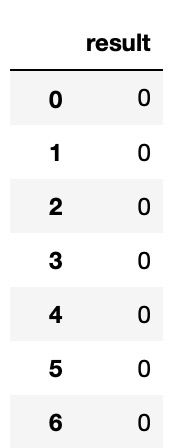
solution = pd.DataFrame({'result':LR_o.predict(X)})
solution
solution是通过我们已经调整好的模型对测试集做预测的最终结果。
得到结果之后,我们就可以上传至竞赛平台与真实值进行对比了。本课件中的代码结果在测试集中预测准确率达0.91428,预测结果显著并可以为实际业务进行辅助决策。

七、总结
通过对测试集的观察,该公司的员工离职现状可以总结如下:
- 当前离职率为11.82%;
- 由于企业培养人才是需要大量的成本, 为了防止人才再次流失, 因此应当注重解决人才的流失问题, 也就是留人, 另外如果在招人时注意某些问题, 也能在一定程度上减少人才流失. 因此, 这里可将对策分为两种, 一种是留人对策, 一种是招人对策。
留人对策
- 建立良好的薪酬制度
- 建立明朗的晋升机制
- 完善奖惩机制, 能者多劳, 也应多得
- 实现福利多样化, 增加员工对企业的忠诚度
- 重视企业文化建设, 树立共同的价值观
- 鼓励员工自我提升
- ………………
招人对策

