Python Seaborn教程
Python Seaborn教程 (Python Seaborn Tutorial)
Seaborn is a library for making statistical infographics in Python. It is built on top of matplotlib and also supports numpy and pandas data structures. It also supports statistical units from SciPy.
Seaborn是一个使用Python制作统计信息图表的库。 它基于matplotlib构建,还支持numpy和pandas数据结构。 它还支持SciPy的统计单位。
Visualization plays an important role when we try to explore and understand data, Seaborn is aimed to make it easier and the centre of the process. To put in perspective, if we say matplotlib makes things easier and hard things possible, seaborn tries to make that hard easy too, that too in a well-defined way. But seaborn is not an alternative to matplotlib, think of it as a complement to the previous.
当我们尝试探索和理解数据时,可视化起着重要作用,Seaborn的目标是使其变得更容易并且成为过程的中心。 放眼来看,如果我们说matplotlib使事情变得容易和困难的事情成为可能,seaborn也会尝试以明确的方式使困难变得容易。 但是seaborn并不是matplotlib的替代品,可以认为它是对前者的补充。
As it is built on top of matplotlib, we will often invoke matplotlib functions directly for simple plots at matplotlib has already created highly efficient programs for it.
由于它是基于matplotlib构建的,因此我们经常会直接调用matplotlib函数以获取简单的图,因为matplotlib已经为其创建了高效程序。
The high-level interface of seaborn and customizability and variety of backends for matplotlib combined together makes it easy to generate publication-quality figures.
完美的,可定制的高级界面以及各种matplotlib后端组合在一起,使生成出版物质量数据变得容易。
为什么选择Seaborn? (Why Seaborn?)
Seaborn offers a variety of functionality which makes it useful and easier than other frameworks. Some of these functionalities are:
Seaborn提供了多种功能,使其比其他框架更有用和更容易。 其中一些功能是:
- A function to plot statistical time series data with flexible estimation and representation of uncertainty around the estimate 绘制具有灵活估计的统计时间序列数据并在估计周围表示不确定性的功能
- Functions for visualizing univariate and bivariate distributions or for comparing them between subsets of data 用于可视化单变量和双变量分布或在数据子集之间进行比较的函数
- Functions that visualize matrices of data and use clustering algorithms to discover structure in those matrices 可视化数据矩阵并使用聚类算法发现这些矩阵中的结构的函数
- High-level abstractions for structuring grids of plots that let you easily build complex visualizations 用于构建图网格的高级抽象,可让您轻松构建复杂的可视化文件
- Several built-in themes for styling matplotlib graphics Matplotlib图形样式的几个内置主题
- Tools for choosing color palettes to make beautiful plots that reveal patterns in your data 用于选择调色板的工具,以绘制精美的图表以显示数据中的图案
- Tools that fit and visualize linear regression models for different kinds of independent and dependent variables 拟合和可视化线性回归模型的工具,用于不同种类的自变量和因变量
Seaborn入门 (Getting Started with Seaborn)
To get started with Seaborn, we will install it on our machines.
要开始使用Seaborn,我们将其安装在我们的计算机上。
安装Seaborn (Install Seaborn)
Seaborn assumes you have a running Python 2.7 or above platform with NumPY (1.8.2 and above), SciPy(0.13.3 and above) and pandas packages on the devices.
Seaborn假定您在设备上运行的Python 2.7或更高版本平台具有NumPY(1.8.2和更高版本),SciPy(0.13.3和更高版本)和pandas软件包。
Once we have these python packages installed we can proceed with the installation. For pip installation, run the following command in the terminal:
一旦安装了这些python软件包,我们就可以继续安装。 对于pip安装,请在终端中运行以下命令:
pip install seabornIf you like conda, you can also use conda for package installation, run the following command:
如果您喜欢conda,也可以使用conda进行软件包安装,请运行以下命令:
conda install seabornAlternatively, you can use pip to install the development version directly from GitHub:
另外,您可以使用pip直接从GitHub安装开发版本:
pip install git+https://github.com/mwaskom/seaborn.git使用Seaborn (Using Seaborn)
Once you are done with the installation, you can use seaborn easily in your Python code by importing it:
安装完成后,可以通过导入在Python代码中轻松使用seaborn:
import seaborn控制人物美学 (Controlling figure aesthetics)
When it comes to visualization drawing attractive figures is important.
在可视化方面,吸引人的图形很重要。
Matplotlib is highly customizable, but it can be complicated at the same time as it is hard to know what settings to tweak to achieve a good looking plot. Seaborn comes with a number of themes and a high-level interface for controlling the look of matplotlib figures. Let’s see it working:
Matplotlib是高度可定制的,但同时又可能会很复杂,因为很难知道要调整哪些设置才能获得美观的图形。 Seaborn具有许多主题和用于控制matplotlib图形外观的高级界面。 让我们看看它的工作原理:
#matplotlib inline
import numpy as np
import matplotlib as mpl
import matplotlib.pyplot as plt
import seaborn as sns

np.random.seed(sum(map(ord, "aesthetics")))

#Define a simple plot function, to plot offset sine waves
def sinplot(flip=1):
    x = np.linspace(0, 14, 100)
    for i in range(1, 7):
        plt.plot(x, np.sin(x + i * .5) * (7 - i) * flip)
sinplot()
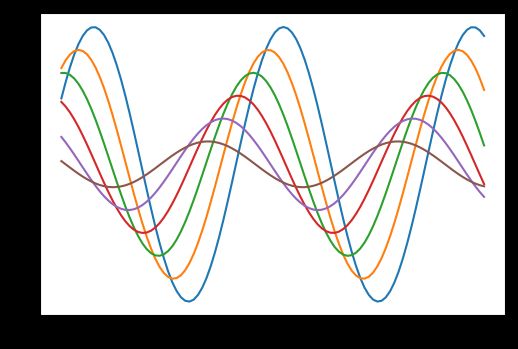
This is what the plot looks like with matplotlib defaults:
这是使用matplotlib默认值时的图:
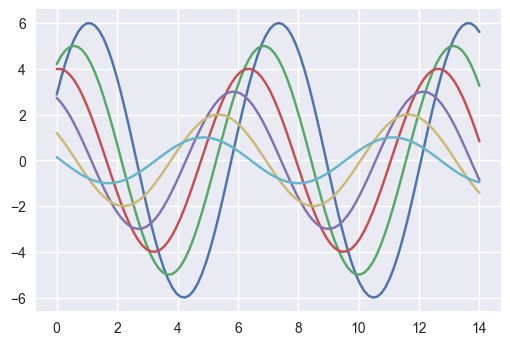
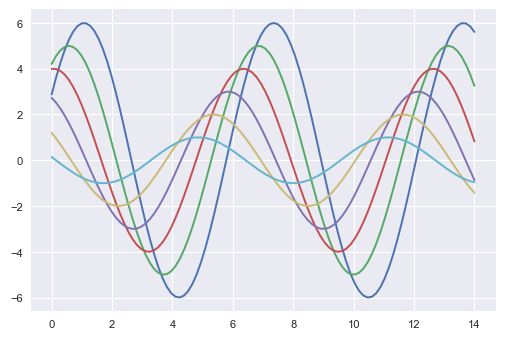
If you want to switch to seaborn defaults, simply call ‘set’ function:
如果要切换到默认值,只需调用“设置”功能:
sns.set()
sinplot()
This is how the plot look now:
现在是这样的样子:
Seaborn图样式 (Seaborn figure styles)
Seaborn provides five preset themes: white grid, dark grid, white, dark, and ticks, each suited to different applications and also personal preferences.
Seaborn提供了五个预设主题:白色网格,深色网格,白色,深色和刻度,每个主题都适合不同的应用程序以及个人喜好。
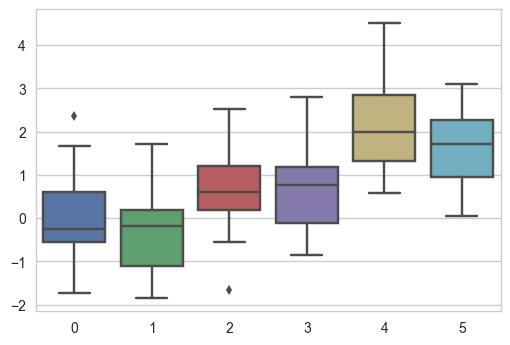
Darkgrid is the default one. The White grid theme is similar but better suited to plots with heavy data elements, to switch to white grid:
Darkgrid是默认选项。 白色网格主题类似,但更适合于具有大量数据元素的图,以切换到白色网格:
sns.set_style("whitegrid")
data = np.random.normal(size=(20, 6)) + np.arange(6) / 2
sns.boxplot(data=data)
The output will be:
输出将是:
For many plots, the grid is less necessary. Remove it by adding this code snippet:
对于许多地块来说,网格是不必要的。 通过添加以下代码片段将其删除:
sns.set_style("dark")
sinplot()
The plot looks like:
情节看起来像:
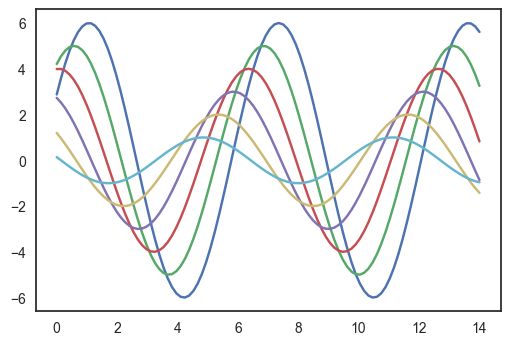
Or try the white background:
或尝试白色背景:
sns.set_style("white")
sinplot()
This time, the background looks like:
这次,背景看起来像:
Sometimes you might want to give a little extra structure to the plots, which is where ticks come in handy:
有时,您可能想给绘图添加一些额外的结构,这是刻度线派上用场的地方:
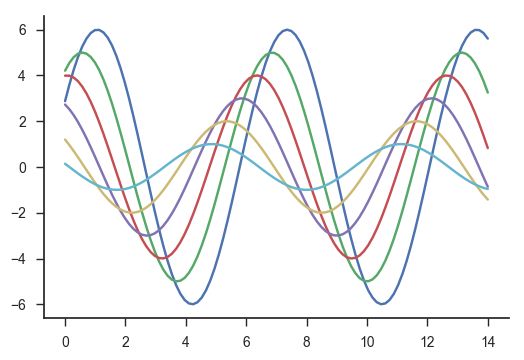
sns.set_style("ticks")
sinplot()
The plot looks like:
情节看起来像:
去除轴刺 (Removing axes spines)
You can call despine function to remove them:
您可以调用despine函数将其删除:
sinplot()
sns.despine()
The plot looks like:
情节看起来像:
Some plots benefit from offsetting the spines away from the data. When the ticks don’t cover the whole range of the axis, the trim parameter will limit the range of the surviving spines:
有些图可以从数据中抵消尖峰。 当刻度不覆盖轴的整个范围时,trim参数将限制尚存的刺的范围:
f, ax = plt.subplots()
sns.violinplot(data=data)
sns.despine(offset=10, trim=True)
The plot looks like:
情节看起来像:
You can also control which spines are removed with additional arguments to despine:
您还可以使用despine的附加参数来控制删除哪些刺:
sns.set_style("whitegrid")
sns.boxplot(data=data, palette="deep")
sns.despine(left=True)
The plot looks like:
情节看起来像:
临时设置图形样式 (Temporarily setting figure style)
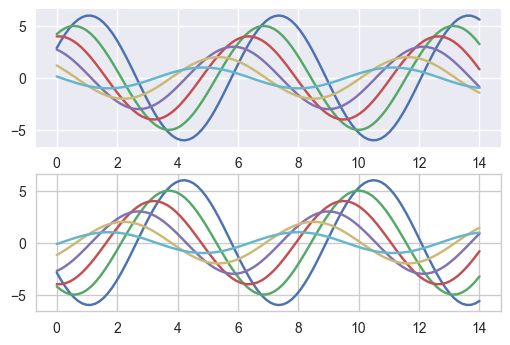
axes_style() comes to help when you need to set figure style, temporarily:
当您需要临时设置图形样式时, axes_style()会为您提供帮助:
with sns.axes_style("darkgrid"):
   plt.subplot(211)
   sinplot()
plt.subplot(212)
sinplot(-1)
The plot looks like:
情节看起来像:
海洋风格的主要元素 (Overriding elements of the seaborn styles)
A dictionary of parameters can be passed to the rc argument of axes_style() and set_style() in order to customize figures.
可以将参数字典传递给axes_style()和set_style()的rc参数,以便自定义图形。
Note: Only the parameters that are part of the style definition through this method can be overridden. For other purposes, you should use set() as it takes all the parameters.
注意:仅覆盖通过此方法作为样式定义一部分的参数。 出于其他目的,应使用set()因为它需要所有参数。
In case you want to see what parameters are included, just call the function without any arguments, an object is returned:
如果要查看包含哪些参数,只需调用不带任何参数的函数,就会返回一个对象:
sns.axes_style()

{'axes.axisbelow': True,
'axes.edgecolor': '.8',
'axes.facecolor': 'white',
'axes.grid': True,
'axes.labelcolor': '.15',
'axes.linewidth': 1.0,
'figure.facecolor': 'white',
'font.family': [u'sans-serif'],
'font.sans-serif': [u'Arial',
 u'DejaVu Sans',
 u'Liberation Sans',
 u'Bitstream Vera Sans',
 u'sans-serif'],
'grid.color': '.8',
'grid.linestyle': u'-',
'image.cmap': u'rocket',
'legend.frameon': False,
'legend.numpoints': 1,
'legend.scatterpoints': 1,
'lines.solid_capstyle': u'round',
'text.color': '.15',
'xtick.color': '.15',
'xtick.direction': u'out',
'xtick.major.size': 0.0,
'xtick.minor.size': 0.0,
'ytick.color': '.15',
'ytick.direction': u'out',
'ytick.major.size': 0.0,
'ytick.minor.size': 0.0}
You can then set different versions of these parameters:
然后,您可以设置这些参数的不同版本:
sns.set_style("darkgrid", {"axes.facecolor": ".9"})
sinplot()
The plot looks like:
情节看起来像:
缩放图元素 (Scaling plot elements)
Let’s try to manipulate scale of the plot. We can reset the default parameters by calling set():
让我们尝试操纵绘图的比例。 我们可以通过调用set()来重置默认参数:
sns.set()The four preset contexts are – paper, notebook, talk and poster. The notebook style is the default, and was used in the plots above:
四个预设上下文是–纸,笔记本,谈话和海报。 笔记本样式是默认样式,并在上面的图中使用:
sns.set_context("paper")
sinplot()
The plot looks like:
情节看起来像:
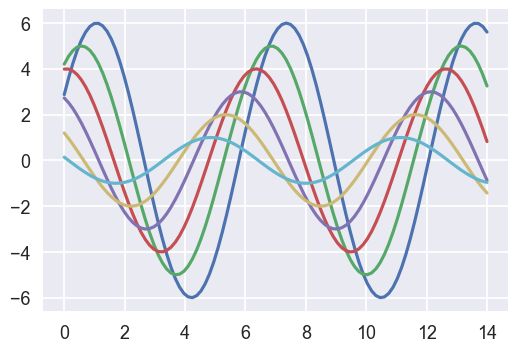
sns.set_context("talk")
sinplot()
The plot looks like:
情节看起来像:
结论 (Conclusion)
In this lesson, we have seen that Seaborn makes it easy to manipulate different graph plots. We have seen examples of scaling and changing context.
在本课程中,我们看到了Seaborn可以轻松操纵不同的图形。 我们已经看到了扩展和更改上下文的示例。
Seaborn makes it easy to visualize data in an attractive manner and make it easier to read and understand.
通过Seaborn,可以轻松以有吸引力的方式可视化数据,并使其更易于阅读和理解。
翻译自: https://www.journaldev.com/18583/python-seaborn-tutorial

