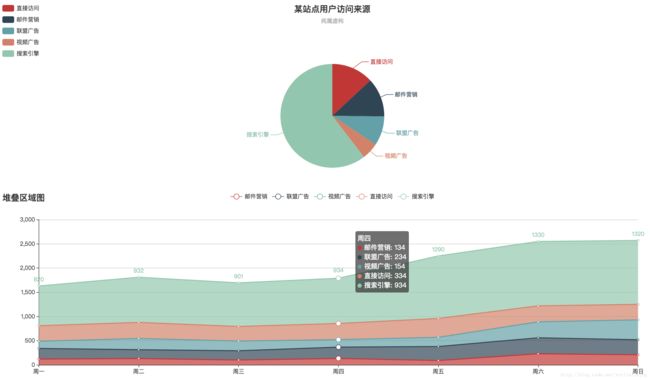
Echart——饼图和堆叠区域图
主要记录下饼图和堆叠区域图的使用,方便工作中快速生成图表
代码
<html>
<head>
  <script src="https://cdn.bootcss.com/jquery/3.2.1/jquery.min.js">script>
  <script src="https://cdn.bootcss.com/echarts/3.8.5/echarts.min.js">script>
head>
<body>
  <div id="pieChart" style="wide:250px;height:400px">
  div>
  <div id="lineChart" style="wide:250px;height:400px">
  div>
  <script type="text/javascript">
    $(document).ready(function() {
      pieChart();
      lineChart();
    });

    function pieChart() {
      var myChart = echarts.init(document.getElementById('pieChart'));
      var option = {
        //这里可以添加 color 属性,修改饼图的颜色
        //color: ['#24AB14', '#335EFF', '#FF8D33', 'blueviolet'],
        title: {
          text: '某站点用户访问来源',
          subtext: '纯属虚构',
          x: 'center'
        },
        tooltip: {
          trigger: 'item',
          formatter: "{a}
{b} : {c} ({d}%)"
        },
        legend: {
          orient: 'vertical',
          left: 'left',
          data: ['直接访问', '邮件营销', '联盟广告', '视频广告', '搜索引擎']
        },
        series: [{
          name: '访问来源',
          type: 'pie',
          radius: '55%',
          center: ['50%', '60%'],
          data: [{
              value: 335,
              name: '直接访问'
            },
            {
              value: 310,
              name: '邮件营销'
            },
            {
              value: 234,
              name: '联盟广告'
            },
            {
              value: 135,
              name: '视频广告'
            },
            {
              value: 1548,
              name: '搜索引擎'
            }
          ],
          itemStyle: {
            emphasis: {
              shadowBlur: 10,
              shadowOffsetX: 0,
              shadowColor: 'rgba(0, 0, 0, 0.5)'
            }
          }
        }]
      };


      // 使用刚指定的配置项和数据显示图表
      myChart.setOption(option);
    }

    function lineChart() {
      var myChart1 = echarts.init(document.getElementById('lineChart'));
      var option = {
        title: {
          text: '堆叠区域图'
        },
        tooltip: {
          trigger: 'axis',
          axisPointer: {
            type: 'cross',
            label: {
              backgroundColor: '#6a7985'
            }
          }
        },
        legend: {
          data: ['邮件营销', '联盟广告', '视频广告', '直接访问', '搜索引擎']
        },
        toolbox: {
          feature: {
            saveAsImage: {}
          }
        },
        grid: {
          left: '3%',
          right: '4%',
          bottom: '3%',
          containLabel: true
        },
        xAxis: [{
          type: 'category',
          boundaryGap: false,
          data: ['周一', '周二', '周三', '周四', '周五', '周六', '周日']
        }],
        yAxis: [{
          type: 'value'
        }],
        series: [{
            name: '邮件营销',
            type: 'line',
            stack: '总量',
            areaStyle: {
              normal: {}
            },
            data: [120, 132, 101, 134, 90, 230, 210]
          },
          {
            name: '联盟广告',
            type: 'line',
            stack: '总量',
            areaStyle: {
              normal: {}
            },
            data: [220, 182, 191, 234, 290, 330, 310]
          },
          {
            name: '视频广告',
            type: 'line',
            stack: '总量',
            areaStyle: {
              normal: {}
            },
            data: [150, 232, 201, 154, 190, 330, 410]
          },
          {
            name: '直接访问',
            type: 'line',
            stack: '总量',
            areaStyle: {
              normal: {}
            },
            data: [320, 332, 301, 334, 390, 330, 320]
          },
          {
            name: '搜索引擎',
            type: 'line',
            stack: '总量',
            label: {
              normal: {
                show: true,
                position: 'top'
              }
            },
            areaStyle: {
              normal: {}
            },
            data: [820, 932, 901, 934, 1290, 1330, 1320]
          }
        ]
      };
      // 使用刚指定的配置项和数据显示图表
      myChart1.setOption(option);
    }
  script>
body>
html>
效果
注意
饼图中调色,如果没有设置,默认使用下面颜色列表:
['#c23531','#2f4554', '#61a0a8', '#d48265', '#91c7ae','#749f83', '#ca8622', '#bda29a','#6e7074', '#546570', '#c4ccd3']可以在 option 中增加 color 属性设置饼图的颜色,比如:
color: ['#24AB14', '#335EFF', '#FF8D33', 'blueviolet'],参考资料
Echart官网
