python实现一元和多元线性回归
定义
确定两种或两种以上变量间相互依赖的定量关系的一种统计分析方法,分为单变量线性回归和多变量线性回归,即一元和多元。
一元线性回归
1.一元线性回归公式
(1) y = θ 0 + θ 1 x + ε y = \theta_{0}+\theta_{1}x + \varepsilon \tag{1} y=θ0+θ1x+ε(1)
其中y为因变量,x为自变量, θ 1 \theta_{1} θ1为斜率, θ 0 \theta_{0} θ0为截距, ε \varepsilon ε为误差。线性回归的目标是为了找到一个函数 y ^ = θ 0 + θ 1 x \hat{y} = \theta_{0}+\theta_{1}x y^=θ0+θ1x使得 ε \varepsilon ε( ε = y − y ^ \varepsilon = y - \hat{y} ε=y−y^)最小
2.损失函数
将方差作为损失函数,目标是使得方差最小。
(2) J ( θ 0 , θ 1 ) = 1 2 m ∑ i = 0 n ( y i − y ^ i ) 2 J(\theta_{0},\theta_{1}) = \frac{1}{2m}\sum_{i=0}^{n}{(y_{i} - \hat{y}_{i})^{2}} \tag{2} J(θ0,θ1)=2m1i=0∑n(yi−y^i)2(2)
3.优化准则,梯度下降
(3) θ 0 = θ 0 − α ∂ θ 0 J ( θ 0 , θ 1 ) \theta_{0} = \theta_{0} - \alpha\frac{\partial }{\theta_{0}}J(\theta_{0},\theta_{1}) \tag{3} θ0=θ0−αθ0∂J(θ0,θ1)(3)
(4) θ 1 = θ 1 − α ∂ θ 1 J ( θ 0 , θ 1 ) \theta_{1} = \theta_{1} - \alpha\frac{\partial }{\theta_{1}}J(\theta_{0},\theta_{1}) \tag{4} θ1=θ1−αθ1∂J(θ0,θ1)(4)
偏导数代表对于 θ j \theta_{j} θj的梯度方向, α \alpha α为步长,中间为减号的原因是因为函数值沿着梯度的方向是函数增加最快的方向,而针对损失函数J来说要求得最小值,所以沿着梯度相反的方向就行了。详细
多元线性回归
一元线性回归是多元线性回归的特例,在做线性回归时应该首先判断哪些特征与结果是相关的,判断方法可以采用协方差或者皮尔逊相关系数。
1.多元线性回归公式
(1) y = θ T X + ε y = \theta^{T}X + \varepsilon \tag{1} y=θTX+ε(1)
其中y为因变量, X = { x 0 , x 1 , . . . , x n } X={\{x_{0},x_{1},...,x_{n}\}} X={x0,x1,...,xn}为特征向量, θ = { θ 0 , θ 1 , . . . , θ n } \theta={\{\theta_{0},\theta_{1},...,\theta_{n}\}} θ={θ0,θ1,...,θn}为每个特征的权重, θ 0 \theta_{0} θ0为截距,默认 x 0 x_{0} x0为1, ε \varepsilon ε为误差。线性回归的目标是为了找到一个函数 y ^ = θ T X \hat{y} = \theta^{T}X y^=θTX使得 ε \varepsilon ε( ε = y − y ^ \varepsilon = y - \hat{y} ε=y−y^)最小
2.损失函数
将方差作为损失函数,目标是使得方差最小。
(2) J ( θ ) = 1 2 m ∑ i = 0 n ( y i − y ^ i ) 2 J(\theta) = \frac{1}{2m}\sum_{i=0}^{n}{(y_{i} - \hat{y}_{i})^{2}} \tag{2} J(θ)=2m1i=0∑n(yi−y^i)2(2)
3.优化准则,梯度下降
(3) θ j = θ j − α ∂ θ j J ( θ ) \theta_{j} = \theta_{j} - \alpha\frac{\partial }{\theta_{j}}J(\theta) \tag{3} θj=θj−αθj∂J(θ)(3)
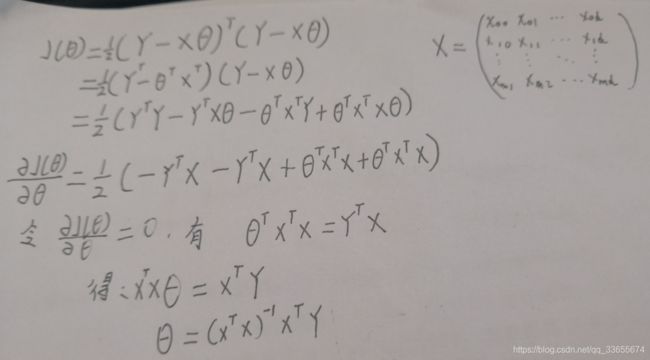
正规方程解
代码
#单元线性回归
import pandas as pd
import numpy as np
import matplotlib.pyplot as plt
d = pd.read_csv('Salary_Data.csv')
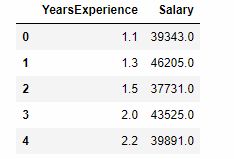
d.head()
#看一下数据的分布情况
%matplotlib inline
df.plot.scatter(x='x1', y='y')

#处理数据,将其变成特征矩阵X和结果矩阵Y
df = pd.DataFrame(data=d,columns=['YearsExperience','Salary'])
df.insert(0,'x0',[1] * df.shape[0])
df = df.rename(columns={'YearsExperience':'x1','Salary':'y'})
x = df[['x0','x1']].values
y = df[['y']].values

#画线性方程和数据的散点图
def plotLiner(x, y, theta):
#     x = np.array(df[0][1],df[-1][1])
#     y = theta[0] + theta[1] * x
    px = np.linspace(x[0][1], x[-1][1], 10000)
    py = theta[0]+theta[1]*px#方程式
    plt.figure(num=1)
    #获取图片并命名
    plt.plot(px,py,color='blue',linewidth=1.0,label='blue')
    plt.plot(x[:,1],y,'bo')
    plt.show()

#梯度下降算法,学习率太大不能收敛,太小难以收敛
def gradientDescent(x,y):
    n = x.shape[1]
    theta = np.ones((n,1))
    numIter = 100000
    alpha = 0.0016
    for i in range(numIter):
        yHat = np.dot(x,theta)
        j = (yHat - y)
        theta = theta - alpha * np.dot(x.transpose(), j)
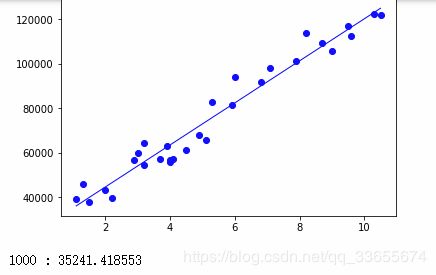
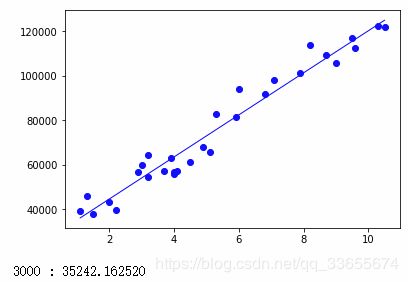
        #每1000次迭代查看一下拟合情况
        if i % 1000 == 0:
            plotLiner(x,y,theta)
            print('%d : %f'%(i,theta.sum()))
    return theta
theta = gradientDescent(x,y)
#多元线性回归,结果是Spend2相关性不高,其实可以不考虑Spend2
mdf = pd.read_csv('COM.csv')
mdf.corr()

stateList = list(mdf['State'].unique())
mdf.insert(0,'x0',[1] * mdf.shape[0])
mdf['State'] = mdf['State'].apply(lambda x : stateList.index(x)+1)
spend1Max = mdf['Spend1'].max()
mdf['Spend1'] = mdf['Spend1'] / spend1Max
spend3Max = mdf['Spend3'].max()
mdf['Spend3'] = mdf['Spend3'] / spend3Max
mdf.head()

X = mdf.iloc[:,[0,1,3]].values
Y = mdf[['Profit']].values

def gradientDescent1(x,y):
    n = x.shape[1]
    theta = np.ones((n,1))
    numIter = 10000
    alpha = 0.001
    for i in range(numIter):
        yHat = np.dot(x,theta)
        j = (yHat - y)
        theta = theta - alpha * np.dot(x.transpose(), j)
    return theta
theta = gradientDescent1(X,Y)

from numpy.linalg import inv
#用正规方程来解
def normalEquation(X,Y):
    theta = np.dot(np.dot(inv(np.dot(X.T,X)), X.T),Y)
    return theta
a = normalEquation(X,Y)


