Coursera Big Data系列课程笔记1
hadoop Cloudera virtual machine 操作
http://github.com/words-sdsc/coursera
big-data-1:安装方式在Introduction to big data课程第一周
big-data-2:安装方式在Big Data Modeling and Management课程第一周
big-data-3:安装方式在Big Data Integration and Processing课程第一周
安装big-data-3等各种工具包
打开 terminal shell window
cd big-data-3
./setup.sh
中间不断的enter/yes
最后source /home/cloudera/.bashrc
week1 文件操作
cd Downloads   ##将工作区转移到downloads文件夹
ls   ##显示工作区的文件
unzip -o xxx.zip   ##解压缩文件xxx
./setup.sh   ##安装setup.sh
q   ##退出more。。
week2 尝试HDFS并行计算
hadoop fs –copyFromLocal words.txt   ##把文件复制到HDFS
hadoop fs –ls   ##显示HDFS中的文件
hadoop fs -cp words.txt words2.txt   ##在HDFS里复制words到words2
hadoop fs -copyToLocal words2.txt   ##把HDFS里的words2复制到本地
hadoop fs -rm words2.txt   ##从HDFS里移除words2
hadoop jar /usr/jars/hadoop-examples.jar   ##查看several example MapReduce applications
hadoop jar /usr/jars/hadoop-examples.jar wordcount   ##了解示例功能用途
hadoop jar /usr/jars/hadoop-examples.jar wordcount words.txt out   ##启用wordcount对words.txt进行计算(需要相关文件在HDFS中),并将结果记录在out文件夹中
hadoop –fs ls out   ##查看out文件夹中的输出结果
hadoop fs –copyToLocal out/part-r-00000 local.txt
more local.txt   ##查看loca文件内容

oocalc   ##打开oocalc工作表软件(类似excel)
week3 查看各类数据
cd Downloads/big-data-2/image ##移动至图片所在文件夹
eog Australia.jpg ##展示图片 Eye of Gnome is a common image viewer on Linux systems.
./dimensions.py Australia.jpg ##查看图片大小
./pixel.py Australia.jpg 5000 0 ##查看图片位置(5000,0)的RGB值

cd Downloads/big-data-2/sensor ##移动至senor数据所在文件夹
more wx-data.txt
more wxt-520-format.txt
./plot-data.py wx-data.txt Ta ##对wx-data数据Ta列绘制折线图

cd Downloads/big-data-2/json ##移动至json数据所在文件夹
more twitter.json
./json_schema.py twitter.json | more ##查看JSON file概要
./print_json.py ##查看指定内容
    twitter.json ##输入查看文件
    99 ##输入查看对象
    text ##输入查看属性
    entities/hashtags ##输入查看属性
week4 Import and query text documents with Lucene(使用Lucene输入和分析文本)
ls data/ ##显示data文件夹下子文件

./runLuceneQuery.sh data   ##导入data文件夹下数据,开始分析数据
    delegates #这时输入任意单词,系统显示相关性
    voters^5 delegates #还可以输入任意单词的权重组合,系统会显示data文件夹下各数据表对该组合的评分

./runLuceneTFIDF.sh data   ##导入data文件夹下数据,开始TF-IDF分析数据
    voters  #data文件夹下各数据表对该单词的评分【单词在某数据表出现数/出现总数*log2(数据表数/单词出现数)】
week5 Perform statistical operations and layout algorithms on graph data in Gephi(用Gephi进行网络分析)
数据源:https://raw.githubusercontent.com/words-sdsc/coursera/master/big-data-2/graph/diseaseGraph.csv
软件下载: https://gephi.org/users/install
week6 读取和图表显示实时数据流
cd Downloads/big-data-2/sensor
ls
./stream-data.py  ##观察来自weather station的数据流
./stream-plot-data.py Sm  ##绘制风速平均值动态折线图
./stream-plot-data.py Ta
ctrl+c ##退出process
week7 读取和显示twitter实时数据流
cd Downloads/big-data-2/json
ls
./LiveTweets.py president   ##实时显示含president的推特数据
./LiveTweets.py time
./PlotTweets.py president   ##绘制含president的推特数据发生频率
week8 jupyter/psql
pyspark ##启动pyspark
psql ##启动Postgres shell数据库
\d ##显示数据库表名单
\d butclicks ##显示butclicks表信息
select * from buyclicks; ##输入查询语句,显示查询信息
select price, userid from buyclicks;
select price, userid from buyclicks where price > 10;
select avg(price) from buyclicks;
select sum(price) from buyclicks;
select adid, buyid, adclicks.userid from adclicks join buyclicks on adclicks.userid = buyclicks.userid;
week9 mongodb
cd Downloads/big-data-3/mongodb ##进入mongo文件夹
./mongodb/bin/mongod --dbpath db ##启动服务器监控(指定服务器地址,显示服务器信息)

打开一个新terminal shell window窗口

cd Downloads/big-data-3/mongodb

./mongodb/bin/mongo  ##启动服务器作业shell
show dbs  ##显示各数据库
use sample  ##定位sample数据库
show collections  ##显示数据表
db.users.count()  ##显示users数据表记录总数
db.users.findOne()   ##任意显示一条users数据表记录
db.users.distinct("user_name")  ##显示去重后的user_name字段信息
db.users.find({user_name:"ActionSportsJax"})  ##查询user_name是ActionSportsJax的记录信息
db.users.find({user_name:"ActionSportsJax"}).pretty()   ##按格式显示上步的信息
db.users.find({user_name:"ActionSportsJax"},{tweet_ID:1}).pretty()   ##只显示tweet_ID字段
db.users.find({user_name:"ActionSportsJax"},{tweet_ID:1,_id:0}).pretty()   ##去除默认的id字段显示
db.users.find({tweet_text:"FIFA"})   ##查找tweet_text等于FIFA的记录
db.users.find({tweet_text:/FIFA/})   ##查找tweet_text含FIFA的记录(模糊查询)
db.users.find({tweet_text:/FIFA/}).count
db.users.createIndex({"tweet_text":"text"})  ##在tweet_text字段上建立一个叫text的索引
db.users.find({text:{$search:"FIFA"}}).count()   ##通过索引text查找含FIFA的数量
db.users.find({text:{$search:"FIFA -Texas"}}).count()   ##通过索引text查找含FIFA不含Texas的数量
db.users.find({tweet_mentioned_count:{$gt:6}})  ##查找tweet_mentioned_count大于6的记录
db.users.find({$where:"this.tweet_mentioned_count > this.tweet_followers_count"}).count()
    ##查找tweet_mentioned_count字段大于tweet_followers_count字段的记录数量,注意需要加上this.代表当前文档
db.users.find({$and:[{tweet_text:"FIFA"},{tweet_mentioned_count:{$gt:4}}]}).count()
    ##查找既满足xxx又满足xx的记录数量
exit ##关闭服务器作业shell
Control-C  ##关闭服务器监控(在第一次打开的terminal shell window)
week9 Pandas DataFrames
pyspark ##启动pyspark
在打开的浏览器中找到Download,big-data-3
右上角New,用python3创建一个新的Notebooks
##这里我理解相当于在通过浏览器中编写python3脚本
##编写好后,按shift+enter,run脚本
[1] import pandas  ##启用pandas包
[2] buyclicksDF=pandas.read_csv('buy-clicks.csv')  ##读取工作目录下csv文件
[3] buyclicksDF  ##显示结果
[4] buyclicksDF.head(5)  ##显示前5行
[5] buyclicksDF.shape  ##表的行列数
[6] buyclicksDF[['price','userId']].head(5)  ##显示price、userid两列
[7] buyclicksDF[buyclicksDF['price']<3].head(5)  ##显示price<3的数据
[8] buyclicksDF['price'].mean()
[9] buyclicksDF['price'].sum()
更多操作介绍
http://pandas.pydata.org/pandas-docs/stable/api.html#computations-descriptive-stats
[10] mergeDF = adclicksDF.merge(buyclicksDF,on='userID') ##通过userid字段合并adclicksDF和buyclicksDF两表week10 splunk and datameer
这两个软件都可以将各种类型的数据,包括实时网络数据、html数据、静态数据、感应器数据等,按一定的条件转换为具体的数据、图表和数据挖掘模型,都可基于hadoop的框架下进行操作。
splunk下载地址:https://www.splunk.com/en_us/download/splunk-enterprise.html?ac=coursera_download
启动网站:http://localhost:8000
搜索:
STNAME="California" CENSUS2010POP>1000000
STNAME="California" CENSUS2010POP>1000000 | table CTYNAME
CENSUS2010POP>1000000 | sort CENSUS2010POP desc |table CENSUS2010POP,CTYNAME
STNAME="California" CENSUS2010POP>1000000 | table CTYNAME,CENSUS2010POP
STNAME="California"  | stats count
STNAME="California"  | stats sum(CENSUS2010POP)
week11 wordcount-in-spark
hadoop fs -ls ##显示hdfs系统中的文档
pyspark #启动网页窗口
在打开的浏览器中找到Downloads/big-data-3
右上角New,用python3创建一个新的Notebooks
编写好后,按shift+enter,run脚本
from pyspark.sql import SQLContext
sqlContext=SQLContext(sc)
[1] lines=sc.textFile("hdfs:/user/coludera/words.txt")  ##将hdfs系统中的文档读取到spark RDD系统中
[2] lines.count  ##查看行数
[3] words=lines.flatMap(lambda line : line.split(" "))  ##flatMap是按照括号里的func生成1对多的结果;这边将各行分解为单词
[4] words.take(5)  ##显示words前5个值
['This','is','the','100th','Etext']
[5] tuples=words.map(lambda word :(word,1))  ##map是按照括号里的func生成1对1的结果;这边是生成一个数组
[6] tuples.take(5)  ##显示前5个值
[('This',1),('is',1),('the',1),('100th',1),('Etext',1)]
[7] counts=tuples.reduceByKey(lambda a,b:(a+b))  ##reduceByKey是按照括号里的fun按key值合并数组
[8] counts.take(5)  ##显示前5个值
[('',517065),('VENTIDIUS',3),('Stockfish,',1),('Corin,',2),('Begin',6)]
[9] counts.coalesce(1).saveAsTextFile('hdfs:/user/cloudera/wordcount/outputDir') ##coalesce将多个部分的计算结果合并为一个;这边将计算结果保存到hdfs系统中
week12 SparkSQL and Spark DataFrame
pyspark #启动网页窗口
在打开的浏览器中找到Downloads/big-data-3/spark-sql
点击SparkSQL.ipynb
[1] form pyspark.sql import SQLContext  ##加载SQLContext
[2] sqlsc=SQLContext(sc)    ##创建一个SQLContext
[3] df =sqlsc.read.format("jdbc") \
   .option("url","jdbc:postgresql://localhost/cloudera?user=cloudera") \
   .option("dbtable","gameclicks") \
   .load()    ##按java数据结构读取指定连接指定表的数据
[4] df.printSchema()  ##显示表结构
[5] df.count()   ##显示表行数
[6] df.show(5)   ##显示前5行
[7] df.select("userid","teamlevel").show(5)   ##显示userid、teamlevel字段前5行
[8] df.filter(df["teamlevel"]>1).select("userid","teamlevel").show(5)   ##显示teamlevel大于1的前5行
[9] df.groupBy("ishit").count().show()   ##显示分组合计结果
[10] from pyspark.sql.functions import *   ##加载aggregate
     df.select(mean('ishit'),sum("ishit")).show()   ##查看表ishit字段的平均值和合计
[11] df2=sqlsc.read.format("jdbc") \
   .option("url","jdbc:postgresql://localhost/cloudera?user=cloudera") \
   .option("dbtable","adclicks") \
   .load()   ##读取另一张表
[12] df2.printSchema()
[13] merge =df.join(df2,'userid')   ##通过userid字段将两表合并起来
[14] merge.printSchema()   ##查看合并结果结构
[15] merge.show(5)
week13 Spark Streaming
因为Spark Streaming需要2个以上的处理器,所以,分配需要通过虚拟机设置分配2个以上处理器。
pyspark #启动网页窗口
在打开的浏览器中找到Downloads/big-data-3/spark-sql
点击Spark-Streaming.ipynb
[1] import re
    def parse(line):
        match =re.search("Dm=(\d+)",line)
    if match:
         val=match.group(1)
             return [int(val)]
    return []            ##创建一个函数parse返回Dm值
[2] from pyspark.streaming import StreamingContext
    ssc = StreamingContext(sc,1)  ##加载并创建一个新的StreamingContext(SparkContext,间隔1s)
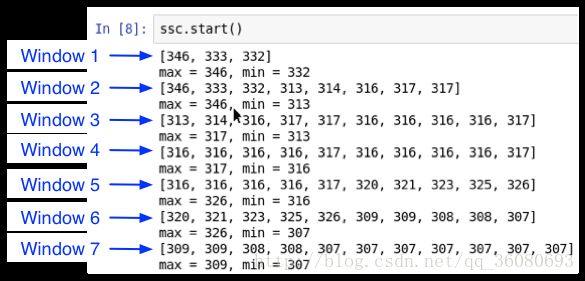
[3] lines=ssc.socketTextStream("rtd.hpwren.edu",12028)  ##建立连接流数据
[4] vals=lines.flatMap(parse) ##将对lines的计算结果储存在新的DStream对象中
[5] window=vals.window(10,5)  ##创建一个长度为10s,每次移动5s的滑窗
[6] def stats(rdd):
    print(rdd.collect())
    if rdd.count()>0:
        print("max={},min={}".format(rdd.max(),rdd.min())
    ##创意一个函数,显示整个rdd的值,显示rdd的最大值、最小值
[7] window.foreachRDD(lambda rdd:stats(rdd))  ##对每个滑窗范围内的RDD使用stats函数
[8] ssc.start() ##显示结果[9] ssc.stop() ##关闭dweek14 mongodb test
cd Downloads/big-data-3/mongodb ##进入mongo文件夹
./mongodb/bin/mongod --dbpath db ##启动服务器监控(指定服务器地址,显示服务器信息)
打开一个新terminal shell window窗口
cd Downloads/big-data-3/mongodb

./mongodb/bin/mongo  ##启动服务器作业shell
show dbs  ##显示各数据库
use sample  ##定位sample数据库
show collections  ##显示数据表
db.users.find({"user.Location":null}).count()  ##查看user下Location值为null的
db.users.find({"user.Location":{$ne:null}}).count()  ##查看user下Location值不为null
db.users.find({$where:"this.user.FollowersCount>this.user.FriendsCount"}).count()   ##查看follow人数多于好友人数的
db.users.find({tweet_text:/http\:\/\//}).pretty()  ##查找推特内容包含http://的
db.users.find({$and:[{tweet_text:{$not:/UEFA/}},{tweet_text:/England/},{tweet_text:/Euro 2016/}]}).count()   ##查找推特内容不包含UEFA,包含England和Euro 2016的
db.users.find({$and:[(tweet_text:/UEFA/},{"user.Location":"Ireland}]}).pretty()   ##查找推特内容包含UEFA,用户所在地在Ireland的
week14 mongodb test2
cd Downloads/big-data-3/mongodb ##进入mongo文件夹
./mongodb/bin/mongod --dbpath db ##启动服务器监控(指定服务器地址,显示服务器信息)
打开一个新terminal shell window窗口
cd Downloads/big-data-3/mongodb
./mongodb/bin/mongoexport -d sample -c users --type=csv -f tweet_text -o itweet ##导出mongo查询结果
--collection ##选择数据表名
--db ##选择数据库名
--fields 1 >,2>,<...> ##选择输出的字段
--query ##查询语句
--out ##输出的表名te
--type= ##输出表格式 导出的文件在Downloads/big-data-3/mongodb文件夹中
week15 spark test
pyspark #启动网页窗口
[1] from pyspark.sql import SQLContext ##加载SQLContext
    sqlContext=SQLContext(sc)     ##创建一个SQLContext
[2] country_lines=sc.textFile('file:///home/cloudera/Downloads/big-data-3/final-project/country-list.csv')  ##读取国家信息csv到RDD中
[3] country_tuples=country_lines.map(lambda line:line.split(", ")))  ##将每一行拆分为一个数组
    country_tuples.take(5)
[4] countryDF=sqlContext.createDataFrame(country_tuples,["country","code"])  ##将country_tuples转换为一个dataframe
        countryDF=printSchema()  ##dataframe的结构
        countryDF.takes=(3)
[5] tweet_lines= sc.textFile('file:///home/cloudera/Downloads/big-data-3/mongodb/itweet')  ##读取tweet数据
[6] tweet_words=tweet_lines.flatMap(lambda line:line.split(" "))  #将每一行拆分为各个单词
    tweet_words.take(5)
[7] tweet_tuples=tweet_words.map(lambda word:(word,1))
    tweet_tuples.take(5)
    tweet.counts=tweet_tuples.reduceByKey(lambda a,b:(a+b))
[8] tweetDF=sqlContext.createDataFrame(tweet_counts,["words","counts"]) ##把tweet也转换为一个dataframe
    tweetDF.printSchema()
    tweetDF.take(3)
[9] merge=countryDF.join(tweetDF,countryDF.country==tweetDF.words)  ##按照关键词(countryDF表中country,tweetDF表中的words)合并俩个dataframe,得到每个国家在推特中被提到了几次
[10] merge.count() ##总共被提到的国家数
[11] from pyspark.sql.functions import sum
    merge.select(sum('counts')).show()  ##被推特提到的国家合计次数
[12] from pyspark.sql.functions import desc
    merge.sort(desc('counts')).show(3)  ##显示被推特提到最多次的国家
[13] merge.filter("country='Wales' OR country='Iceland'").show()  ##显示Wales和Iceland两个国家被提到的次数
[14] from pyspark.sql.functions import mean
    merge.select(mean('counts')).show()  ##显示各国平均被提到的次数
week16 KNIME
基于Eclipse环境的开源商业智能工具。KNIME是通过工作流来控制数据的集成、清洗、转换、过滤,再到统计、数据挖掘,最后是数据的可视化。整个开发都在可视化的环境下进行,通过简单的拖曳和设置就可以完成一个流程的开发
下载地址:
https://www.knime.org/downloads/overview?quicktabs_knimed=1#quicktabs-knimed
KNIME Website
KNIME Getting Started
KNIME Online Self-Training
KNIME Quickstart Guide
KNIME Node Documentation
KNIME Learning Hub
KNIME Community
KNIME Labs
week17 spark data exploration
pyspark #启动网页窗口
[1] from pyspark.sql import SQLContext ##加载SQLContext
    sqlContext=SQLContext(sc)     ##创建一个SQLContext
[2] df=sqlContext.read.load('file:///home/cloudera/Downloads/big-data-4/daily_weather.csv',
    format='com.databricks.spark.csv',
    header='true',inferSchema='true') ##读取天气数据到数据框中
[3] df.columns  ##显示数据框列头
[4] df.printSchema() ##显示数据框列信息
[5] df.describe().toPandas().transpose()  ##显示数据框描述性统计信息
[6] df.describe('air_pressure_9am').show()  ##显示数据框某列描述性统计信息
[7] len(df.columns) ##显示列数
[8] df.count() ##显示行数
[9] df2=df.na.drop(subset=['air_pressure_9am']) ##去除某列字段缺失数据行
[10] df2.count()
[11] df2.stat.corr("rain_accumulation_9am","rain_duration_9am") ##a列与b列计算相关系数