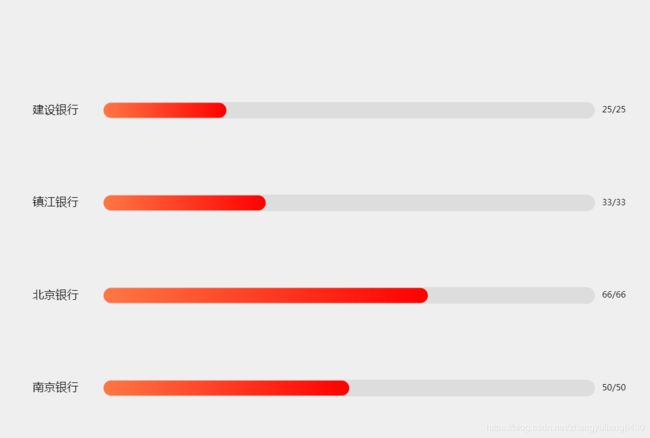
echarts 横向柱状图
echarts 柱状图 两层 具体代码如下
 var myColor = ['#81E7ED'] //内柱状图颜色
 var dataLine = [50, 66, 33, 25]
 let positionLeft = 0.4,
    max = 100 + 2*positionLeft
 var option = {
     grid: [
         {
         left: '8%',
         top: '12%',
         right: '5%',
         bottom: '8%',
         containLabel: true
     },
     {
         left: '10%',
         top: '12%',
         right: '5%',
         bottom: '8%',
         containLabel: true
     }
         ],
     xAxis: [{
         max:max,
         show: false
     }],
     yAxis: [{
         axisTick: 'none',
         axisLine: 'none',
         offset: '27',
         axisLabel: {
             textStyle: {
                 color: '#000000', //y轴字体颜色
                 fontSize: '16'
             }
         },
         data: ['南京银行', '北京银行', '镇江银行', '建设银行']
     }, {
         axisTick: 'none',
         axisLine: 'none',
         show: false,
         axisLabel: {
             textStyle: {
                 color: '#ffffff',
                 fontSize: '16'
             }
         },
         data: [1, 1, 1, 1]
     }, {

         axisLine: {
             lineStyle: {
                 color: 'rgba(0,0,0,0)' //y轴线颜色
             }
         },
         data: []
     },
     {  //设置柱状图右边参数
					        show: true,
					        inverse: true,
					        data: dataLine,
					        axisLine: {
					            show: false
					        },
					        splitLine: {
					            show: false
					        },
					        axisTick: {
					            show: false
					        },
     ],
     series: [

     {
         name: '条',
         type: 'bar',
         stack: 'b',
         yAxisIndex: 0,
         data: dataLine,
         label: {
             normal: {
                 show: false,
                 position: 'right',
                 distance: 10,
                 formatter: function(param) {
                     return param.value + '%'
                 },
                 textStyle: {
                     color: '#ffffff',
                     fontSize: '16'
                 }
             }
         },
         barWidth: 21,
         itemStyle: {
             normal: {
                    color: new echarts.graphic.LinearGradient(
                      1, 0, 0, 0,
                    [
                        {offset: 0, color: '#FF0000'},
                        {offset: 1, color: '#FF7744'}
                    ]
                 ),

                  barBorderRadius:[100, 100, 100, 100],
             }
         },
         z: 2
     }, { //背景灰框
         name: '白框',
         type: 'bar',
         yAxisIndex: 1,
         barGap: '-100%',//设置-100% 则表示灰色柱状图与红色柱状图重合
         data: [99.8, 99.9, 99.9, 99.9],
         barWidth: 21,
         itemStyle: {
             normal: {
                 color: '#DDDDDD',
                 barBorderRadius:[100, 100, 100, 100],
             },

         },
         z: 1  // 设置维度越高这表示覆盖低的
     },
     {
         name: '外框',
         type: 'bar',
         yAxisIndex: 2,
         barGap: '-100%',
         data: [100, 100, 100, 100],
         barWidth: 23,
         label: {
             normal: {
                 show: true,
                 position: 'right',
                 distance: 10,
                 color:'#000000',
                formatter: function(data) {
                  return dataLine[data.dataIndex] +"/"+dataLine[data.dataIndex];
                },
             }
         },
            itemStyle: {
             normal: {
                 color: '#DDDDDD',
                  barBorderRadius:[100, 100, 100, 100],
             }
         },

         z: 0
     }
     ]
 }
效果图如下:
其中注意事项:
- inverse: true, 在X轴和Y轴设置,表示取值是否倒叙
- 想让echarts 跟随屏幕大小而变化则如下:
InstitutionalCirculationChart.setOption({
       option={};
});
//使用制定的配置项和数据显示图表
$(window).resize(function() {
		InstitutionalCirculationChart.resize();
});
