R countcolors包:像素级分析处理图片
![]()
作者:李誉辉
四川大学在读研究生
转载自公众号:EasyCharts
1 简介
countcolors包是Hannah Weller编写的,根据”RGB色值范围“查找图片中的像素点,可以统计某设置范围内的像素点占所有像素点的比例,该比例相当于面积比。还可以更改该像素点为指定的颜色。
笔者发现CRAN版本的包有一些bug,在笔者与作者通过email亲切友好沟通之后,
Hannah先生更新了包,修复了几个bugs。如图所示:
在这里,对Hannah先生表示感谢。CRAN版本的更新还有段时间。github版安装方式:
devtools::install_github("hiweller/countcolors")
2 工作原理
2.1 RGB颜色空间
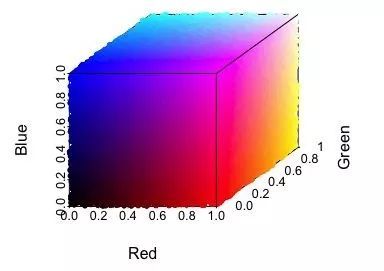
countcolors主要基于RGB颜色空间(red红,green绿,blue蓝)进行度量,如下图的模型所示,每个颜色由red, green, 和blue三个坐标轴上坐标所定义。 每个原色轴刻度范围为从0到255(若是单位化处理的向量,则从0到1)。所以,对于纯红色,则:red坐标为1, green坐标为0, blue坐标为0。常用的洋红magenta,其为红蓝混合色,RGB色值为[1, 0, 1]。
2.2 RGB色值范围(边界区域)
为了确定特定颜色的像素点位置,countcolors中,将首先在颜色空间上确定一个边界区域,然后针对图片上所有在该边界区域内的像素点,进行计数。这里存在2种方法定义边界区域:
在颜色空间模型,针对三原色,设置3个刻度范围(3个最低值和3个最大值)。 然后就能根据这些最值,确定一个立方体,该立方体极为边界区域。
在颜色空间模型中,选取一个空间点作为颜色中心,然后指定一个半径,
这样就能画一个空间球,将该球作为边界区域。
rectangular range (立方体边界) 以定义magenta颜色像素点边界区域为例,magenta颜色的RGB色值为[1, 0, 1],将该数字稍微扩展一下,可以用下面三个条件来定义该边界区域:
Red: 0.7 - 1.0
Green: 0 - 0.3
Blue: 0.7 - 1.0
然后搜索满足基于这3个条件的像素点,
2.3 Spherical ranges (球形边界)
很多时候,需要通过指定中心的RGB色值和颜色空间半径来设定像素点的边界区域。比如说,我们查找“苔藓绿”像素点, 其RGB色值为[0.4, 0.7, 0.4]。如果我们设置radius非常小,仅三原色数值中最大值的5%, 则仅仅得到数量很少的像素点。如果增加radius到25%, 则得到更大的边界区域和数量很多的像素点。所有的countcolors都是基于用户指定的颜色范围来查找像素点,然后进行计数。还有一系列诊断工具check用户是否选取了正确的颜色范围。
2.4 色彩工具
对于RGB色值的提取,大部分商业绘图软件,如PhotoShop,Ai内都有相应的工具。
专门的小工具,推荐使用ColorPix,下载地址。
取色网站推荐:HTML拾色器 和ColorBrewer。
3 实例
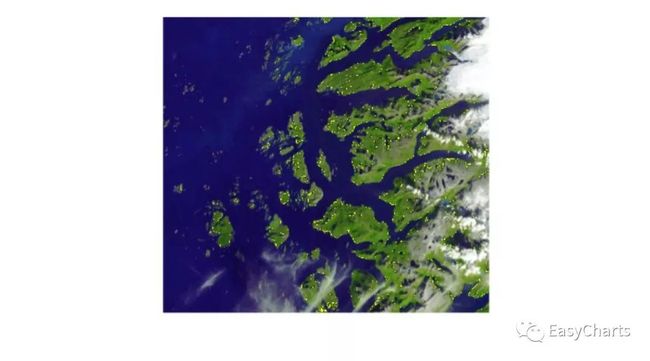
countcolors包内没有几个函数,函数参数也不复杂,笔者就直接按例子讲解使用方法了。我们以NASA对挪威的一张航拍图片为例,用countcolors进行处理。
3.1 plotPixels()
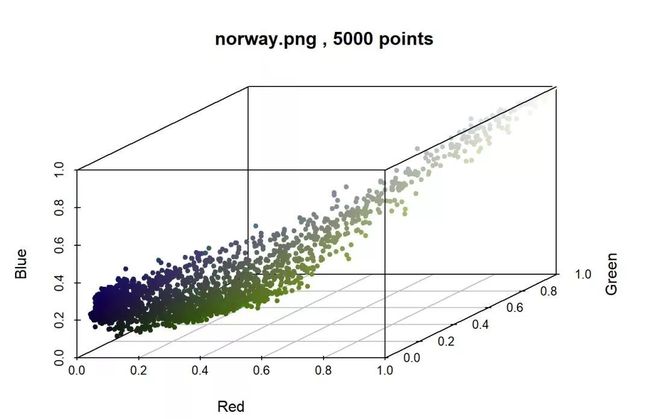
使用plotPixels()函数打散像素点,在RGB颜色空间上绘制像素点簇集。
library(countcolors)library(colordistance)

norway_raw <- loadImage(path = "E:/R_input&output/images_input/norway.png", lower = NULL, upper = NULL)
plotPixels(norway_raw, lower = NULL, upper = NULL, n = 5000)
假设我们想计算海岸线上绿色植物的分布面积,则需要计算绿色像素点在图片中所占的面积百分百。为了实现这点,需要定义一个颜色范围,以搜索在该边界区域内的像素点。然后计算边界区域内的像素点占所有像素点的比例。最后check刚刚是否选择了正确的参数,可以采用调整目标color来观察对比。
3.2 选择恰当的颜色范围
使用countcolors()函数成功的关键在于指定恰当的颜色范围。为了确定恰当的颜色范围,可以试试下面几种方法:
使用工具提取关键点的RGB色值,如目标像素点和边界像素点的RGB色值。
使用k-means聚类可视化,找出所有像素点RGB色值的分组情况,并提取各组中心色值。
最后一个稍微有些复杂,但是我们可以使用colordistance()函数作1个一维的聚类分析:
library(countcolors)
library(colordistance)
# 找出 K-means 聚类
kmeans.clusters <- colordistance::getKMeanColors(path = "E:/R_input&output/images_input/norway.png", n = 3, plotting = FALSE)
colordistance::extractClusters(kmeans.clusters)
|
R |
G |
B |
Pct |
|---|---|---|---|---|
| 1 | 0.32278375 | 0.41330814 | 0.2366413 | 0.22575 |
| 2 | 0.08517767 | 0.05205252 | 0.2639991 | 0.43655 |
| 3 | 0.98529034 | 0.98659153 | 0.9840060 | 0.33770 |
为了将聚类颜色簇以交互式图形展示出来,可以使用colordistance::plotClusters()函数,这个比较复杂先掠过,从简单的入手。其中一个绿色RGB色值是:[0.34, 0.45, 0.24],我们将该色值作为基准,然后设置一系列的不同的半径(针对球形边界区域)或边界范围(针对立方体边界区域)。在countcolors()函数中,边界范围可以用1个长度为3的数字向量指定,元素顺序与R-G-B顺序一致。 具体指定方式如下图:
library(countcolors)
library(colordistance)
center.spherical <- c(0.24, 0.45, 0.24)
# 指定球形边界区域中心坐标
lower.rectangular <- c(0.2, 0.35, 0.2)
# 指定RGB色值下限
upper.rectangular <- c(0.3, 0.55, 0.3)
# 指定RGB色值上限,上限中对应元素value不小于下限
基于k-means聚类结果来设置颜色范围理论上很好,但是实际可能不太如意。因为与聚类算法关系很大,参数设置不当,则会将所有颜色聚集在一起,或将其分成大量簇,不是太多就是太少。只有在green, blue, white数值相差较大时,才能很好的运行,这样其中一个像素点才不会同时与多个簇相连。但是对于复杂性更高的图形,基于k-means聚类来设置颜色范围效果更好。
3.3 像素点分析过程
既然已经获得了颜色范围,接下来就可以使用计数函数countColors()了。countColors()函数通过调动包内其它函数可以发挥以下3种功能:
给像素点定位,返回像素点在图片上的像素行列值。
确定在颜色范围内的像素点的比例(可以选择忽略某种颜色的背景)。
通过指定目标颜色,将颜色范围内的像素点掩盖掉,
方便check是否选择了恰当的目标颜色和颜色范围。
countColors()函数是通过调动其它函数来实现上诉功能的。现在我们直接使用其它函数来实现同样的功能。这些函数包含:
图片加载函数:
png::readPNG(),jpeg::readJPEG()。像素点统计函数:
sphericalRange()或rectangularRange()统计在边界区域内的像素点。改变像素点颜色函数:
changePixelColor()
3.3.1 像素点统计函数
3.3.1.1 sphericalRange()
该函数基于中心点坐标和半径来定义边界区域。然后返回一个列表。
该列表中包含在给定边界区域内:
像素点在图片上的行和列索引值(pixel.idx)、
像素点的计数(pixel.count)、
像素点占总数的比例(img.fraction)、
原图片的RGB数组(original.img)。
library(countcolors)
library(colordistance)
# 读取图片文件
norway <- jpeg::readJPEG("E:/R_input&output/images_input/norway.jpg")
## 基于10%半径,找出所有的像素点
norway.spherical <-countcolors::sphericalRange(norway, center = center.spherical,radius = 0.1, color.pixels = FALSE, plotting = FALSE)
names(norway.spherical)
# 查看返回列表中元素名称,
norway.spherical$img.fraction
## [1] "pixel.idx" "pixel.count" "img.fraction" "original.img"
## [1] 0.10932073.3.1.2 rectangularRange()
下面是使用立方体边界区域的过程,指定upper和lower参数。
library(countcolors)
library(colordistance)
# 采用函数默认的颜色上限和下限,相当于输出原图
norway.rectangular <- countcolors::rectangularRange(norway, upper = upper.rectangular, lower = lower.rectangular,
# 默认上下限
 target.color = "yellow")
# 指定掩盖色为黄色,无效# 采用前面实验的上下限
norway.rectangular <- countcolors::rectangularRange(norway, upper = c(0.55, 0.75, 0.4), lower = c(0.1, 0.25, 0), target.color = "yellow")
# 指定掩盖色为黄色
norway.rectangular$img.fraction
# 查看像素点占比
## [1] 0.18848863.3.2 changePixelColor()改变像素点颜色
在上一个代码块中,我们设置半径radius比较保守,仅仅10%, 结果像素点占比仅仅13.7%。仅仅从数字很难看出是否该比例是否合适,还是需要可视化展示。接下来我们指定其它颜色,来更改像素点颜色。
library(countcolors)
library(colordistance)
# 更改了颜色范围内的像素点颜色为洋红色
countcolors::changePixelColor(norway, norway.spherical$pixel.idx, target.color = "magenta")
上图结果表明,大部分视觉范围内的绿色都被成功转换为洋红,但是还有一些未被转换。针对这种情况,可以调整center color,或扩大半径。首先我们采用增加半径的方法,在sphericalRange()函数中,也可以通过设置参数plotting = TRUE来更改颜色。这也是通过调动changePixelColor()函数来实现的。
library(countcolors)
library(colordistance)
# 设置半径为15%
norway.spherical <- countcolors::sphericalRange(norway, center = center.spherical, radius = 0.15,color.pixels = FALSE, plotting = TRUE,
# plotting = TRUE修改颜色target.color = "magenta")
# target.color设置掩盖色
norway.spherical$img.fraction
# 结果显示:像素点占比为19.5%
## [1] 0.1953728上图中,所有视觉范围内的绿色都被洋红掩盖了,恰好海洋、云层、山峰没有被掩盖。这个半径15%是通过好几次不同实验探索出来的。
3.4 countColors()的使用
countColors()函数除了上面提到的功能,还有其它功能:
保存修改颜色后的图片到文件夹,包括同时显示出来。
可以指定背景色的RGB范围,并将其忽略掉,不计入计算。
同时分析更改多种颜色。
3.4.1 同时分析更改多种颜色
如果需要计算图片中白色和绿色的占比,可以分别指定白色和绿色的中心坐标,并分别指定半径。如下图:
library(countcolors)
library(colordistance)
# 确定绿色和白色的中心坐标
green.center <- c(0.24, 0.45, 0.24)
white.center <- c(1, 1, 1)
two.colors <- countcolors::countColors(path = "E:/R_input&output/images_input/norway.jpg",color.range="spherical",
# color.range指定边界类型center = c(green.center, white.center),
# 向量指定2个中心点radius = c(0.15, 0.1),
# 指定2个半径,顺序与center对应bg.lower=NULL, bg.upper=NULL, plotting = TRUE,target.color=c("magenta", "cyan"))
#向量指定掩盖色,顺序与center同
# 提供2个颜色的总占比
two.colors$pixel.fraction
## [1] 0.51640263.4.2 指定背景色RGB范围
若我们想忽略海洋,仅仅确定绿色在陆地所占的面积,即指定dark blue为背景色,使用2个参数bg.lower和bg.upper指定背景色的上下限,如下所示:
library(countcolors)
library(colordistance)
green.center <- c(0.24, 0.45, 0.24)
bg.upper <- c(0.2, 0.2, 0.45)
bg.lower <- c(0, 0, 0)
bg.ignore <- countcolors::countColors(path = "E:/R_input&output/images_input/norway.jpg",color.range = "spherical", center = green.center, radius = 0.15, bg.lower = bg.lower, bg.upper = bg.upper, plotting = TRUE)
bg.ignore$pixel.fraction
# 返回忽略背景色的像素点占比
## [1] 0.31305243.4.3 保存图片
通过设定参数save.indicator可以保存修改颜色后的图片到文件夹。若设定save.indicator = TRUE则将图片输出到导入的文件夹。若用文件夹路径及文件名指定该参数,则将图片输出到路径下的文件夹。
library(countcolors)
library(colordistance)
green.center <- c(0.24, 0.45, 0.24)
bg.upper <- c(0.2, 0.2, 0.45)
bg.lower <- c(0, 0, 0)
bg.ignore <- countcolors::countColors(path = "E:/R_input&output/images_input/norway.jpg",color.range = "spherical", center = green.center, radius = 0.15, bg.lower = bg.lower,bg.upper = bg.upper, plotting = FALSE, save.indicator = TRUE)
4 批量分析
如果需要分析多张图片,使用countColorInDirectory()函数更加方便。该函数是countColors()函数的包装,将对指定的directory中的JPEG或PNG图片进行逐一分析。基于同样的参数进行分析, 然后返回一个countColors()列表组成的一个大列表。相比countColors()函数,增加了一个参数:folder,表示指定一个图片文件夹。
library(countcolors)
library(colordistance)
folder <- system.file("extdata", package = "countcolors")
# Screen out white in both the flower image and the pelican image
upper <- c(1, 1, 1)
lower <- c(0.8, 0.8, 0.8)
white.screen <- countcolors::countColorsInDirectory(folder, color.range = "rectangular",upper = upper, lower = lower, bg.lower = NULL, plotting = TRUE, target.color = "turquoise")
5 彩色渲染
5.1 原始图片
针对很多黑白图片,色彩不够丰富,颜值不够,所以接下来,将探索将黑白图片渲染为彩色。虽然Photoshop等一些商业性图片处理软件也能彩色渲染,但是精确度远远没有程序手动调整高。
5.2 分析像素点
library(countcolors)
library(colordistance)
clouds <- loadImage(path = "E:/R_input&output/images_input/changecolors/black_white_3_0.png",lower = NULL, upper = NULL)plotPixels(clouds, lower = NULL, upper = NULL, n = 5000)
5.3 开始渲染
因为RGB中心较多,为了体现更改颜色的过程,将图片制作成gif动画输出。
library(scales) #
library(countcolors)
library(colordistance)# 生成中心点坐标
length(seq(0, 1, 0.05)) # 刚好20段
base_values <- seq(0.025, 0.975, by = 0.05)
# 刚好20个# 生成12个长度的颜色向量, 颜色向量组成数据框
vector_1 <- as.vector(col2rgb("magenta")) / 255
vector_2 <- as.vector(col2rgb("cyan")) / 255
colors_df <- data.frame(coord_1 = seq(vector_1[1], vector_2[1], len = length(base_values)), # 或许可以使用其它插值函数
 coord_2 = seq(vector_1[2], vector_2[2], len = length(base_values)), coord_3 = 1)

colors_df <- as.data.frame(t(as.matrix(colors_df)))
# 转置数据框
path_prefix <- "E:/R_input&output/images_input/changecolors/black_white_3_"# 给所有像素点更改颜色
for (n in 1:length(base_values)) {
  full_masked <- countColors(path = paste(path_prefix, n-1, ".png", sep = "", collapse = ""), color.range="spherical",
# color.range指定边界类型
enter = rep(base_values[n], 3), radius = 0.025, bg.lower=NULL, bg.upper=NULL, plotting = TRUE,target.color = colors_df[,n], save.indicator = paste(path_prefix, n, ".png", sep = "", collapse = "") )
}## [1] 21文末,再次对Hannah先生表示感谢。
![]()
····
往期精彩:
R_插值_拟合_回归_样条
R_circlize包_和弦图(一)
R_circlize包_和弦图(二)
R_ggplot2基础(一)
R_ggplot2基础(二)
R_ggplot2基础(三)
R_ggplot2基础(四)
R_3D图(一)
R_3D图(二)
R_3D图(三)
····
![]()
![]()
公众号后台回复关键字即可学习
好看点一下 大家都知道回复 爬虫 爬虫三大案例实战
回复 Python 1小时破冰入门回复 数据挖掘 R语言入门及数据挖掘
回复 人工智能 三个月入门人工智能
回复 数据分析师 数据分析师成长之路
回复 机器学习 机器学习的商业应用
回复 数据科学 数据科学实战
回复 常用算法 常用数据挖掘算法


