ggpubr包绘制符合期刊出版要求图形
提示:
- 阅读本文需要有一定的R语言和ggplot2基础,不熟悉ggplot2语法,可能会存在困难
- 部分代码段用到了管道操作,最好是熟悉tidyverse包,以及阅读过《R for Data Science》
文章目录
- ggpubr包简介
- 预加载包 loading
- 数据分布图 distribution
- 一维散点图 ggstrpchart()
- 箱线图 ggboxplot()
- 小提琴图 ggviolin
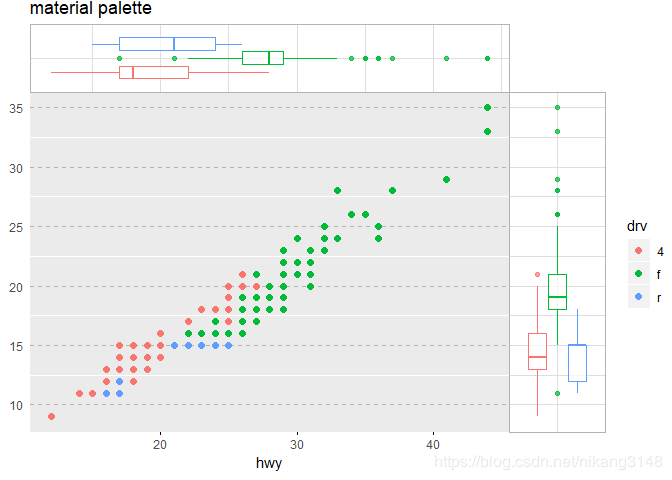
- 散点直方图(组合图形)ggscatterhist()
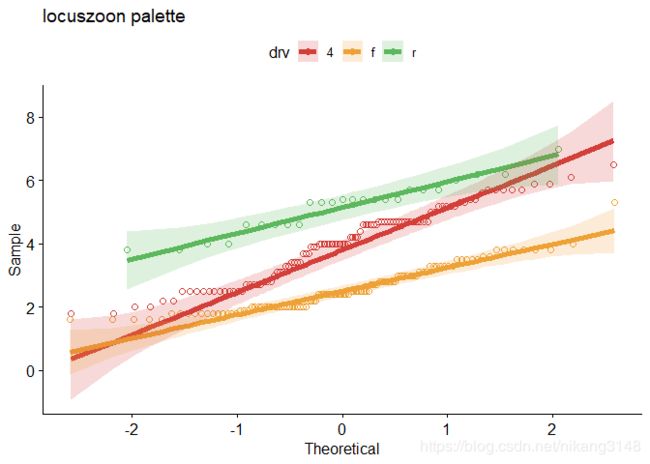
- Q-Q图(是否符合分布)ggqqplot()
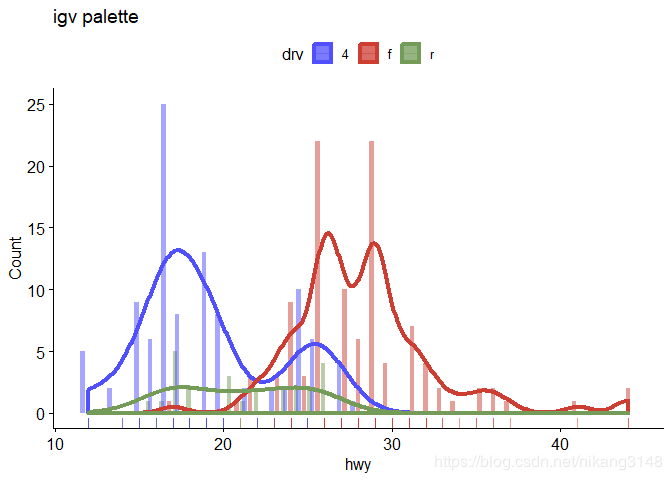
- 直方图 gghistogram()
- 概率累积分布图
- 密度曲线图 ggdensity()
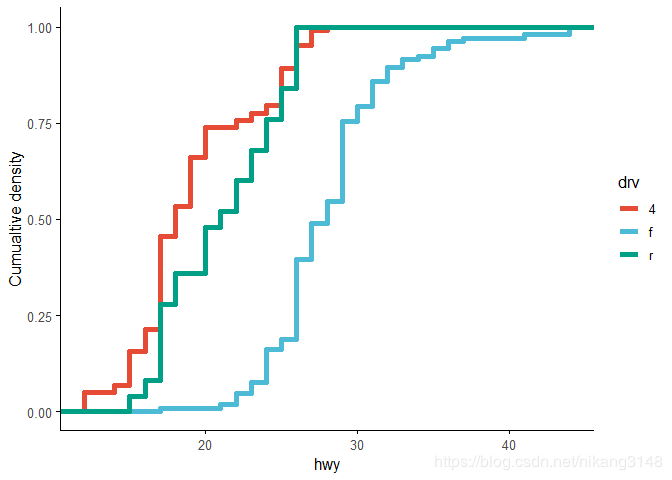
- 累积分布曲线图
- Cleveland点线图 ggdotchart()
- 点图 ggdotplot()
- 统计变换图 stat_transform
- 散点图 scatter plot
- 柱状图 ggbarplot()
- 点线图 ggline()
- 饼图(pie)
- 牛眼图(donutchart)
- 气泡图 bublle plot
- 误差图 errorplot
- 特殊数据图 special plot
- 差异表达数据 MA-plot
- 配对比较图 paired data plot
- 绘制表格
- 文字画
- 图形调整
- 图形组合 arrange
- 更改参数
- 格式调整ggpar
- 标签字体
- 对图形进行修饰annotate
- 改变坐标轴尺度xscale(), yscale()
- 改变作图区背景色
- 设置图区边线 border()
- 设置调整调色板
- 主题相关
- 旋转
- 添加元素
- 增加网格线add gridlines
- 增加分面
- 增加文字标签
- 在已有图形上增加辅助统计量se,sd等
- 添加置信区间换图
- 图上添加统计结果
- 添加元素
- 删除元素
- 统计数据输出
- 均值比较
- 分组描述统计desc_statby()
- 元素输出
- 执行ggplot函数
- 图例输出
- 点线形式输出
- 调色板输出get palette
ggpubr包简介
ggplot2 (Hadley Wickham开发)是目前R语言数据可视化的主流。与R基础绘图系统相比,基于grid绘图系统的ggplot2已经在语法理解性上已经进步很多,但是通过ggplot2绘制用于学术杂志的图形,仍然需要较多的绘图函数(或者加载一些写好的模板代码)。为此Alboukadel Kassambara基于ggplot2、ggsci包开发了ggpubr用于绘制符合出版物要求的图形。该包封装了很多ggplot2的绘图函数,并且内嵌了ggsci中很多优秀的学术期刊配色方案,值得学习使用。
安装方法见https://rpkgs.datanovia.com/ggpubr/index.html
- 目前也可以在CRAN上直接安装
- github install
预加载包 loading
需要预加载的包主要是:
- tidyverse
- ggpubr
数据分布图 distribution
分布特征图用于可视化数据的分布是否符合某种分布,将数据点离散分组,通过形状、颜色、大小等图形参数将数据分布差异显示出来。主要图形有:
- 一维散点图(数量少适用) strip chart
- 箱线图 boxplot
- 小提琴图 violin chart
- 散点直方图(组合图形)scatter histogram
- Q-Q图(是否符合分布)Q-Q chart
- 直方图 histo
- 密度曲线图 density chart
- Cleveland点线图 Cleveland’s Dot Plots
- 点图 Dot plot
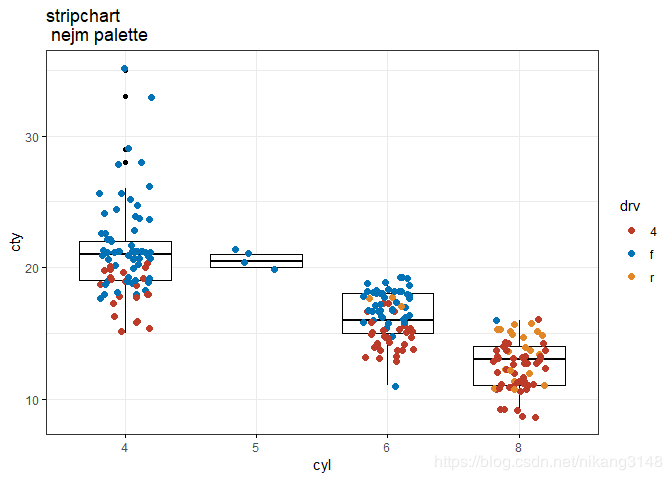
一维散点图 ggstrpchart()
# x continous
ggstripchart(mpg,x="cyl",y="cty",
              color="drv",
              fill="drv",
              palette="nejm",
              shape=21,
              size=2,
              add=c("boxplot"),# one of “none”, “reg.line”, “loess”
              add.params=list(color="black",fill="NA"),
              error.plot="errorbar",
              title="stripchart \n nejm palette",
              # label="drv",
              # font.label = list(size=14,face="italic",color="black"),
              # label.select="r",
              #repel=T,
              #label.rectangle=T,
              # jitter=0.2,
              position=position_jitter(0.2),
              ggtheme=theme_bw()

)
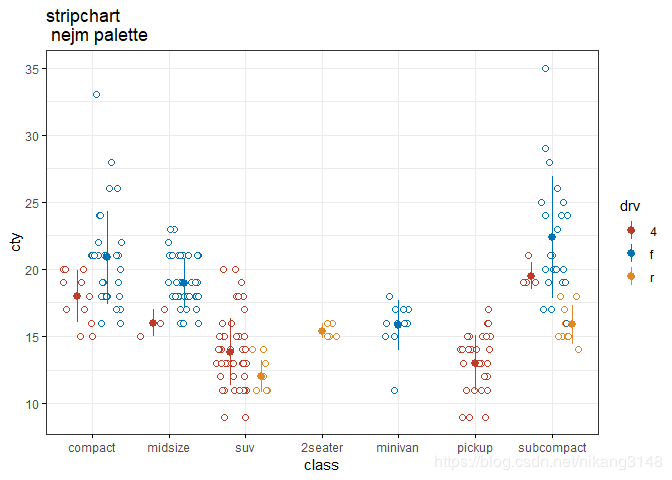
#分类变量x
ggstripchart(mpg,x="class",y="cty",
               color="drv",
              #   fill="drv",
              palette="nejm",
              shape=21,
              size=2,
              add="mean_sd",# one of “none”, “reg.line”, “loess”
              add.params=list(color="drv",fill="NA"),
             # error.plot="crossbar",
              title="stripchart \n nejm palette",
              #   label="drv",
              # font.label = list(size=14,face="italic",color="black"),
              # label.select="r",
              #repel=T,
              #label.rectangle=T,
              jitter=0.5,
              position=position_jitterdodge(),
              ggtheme=theme_bw()
             )
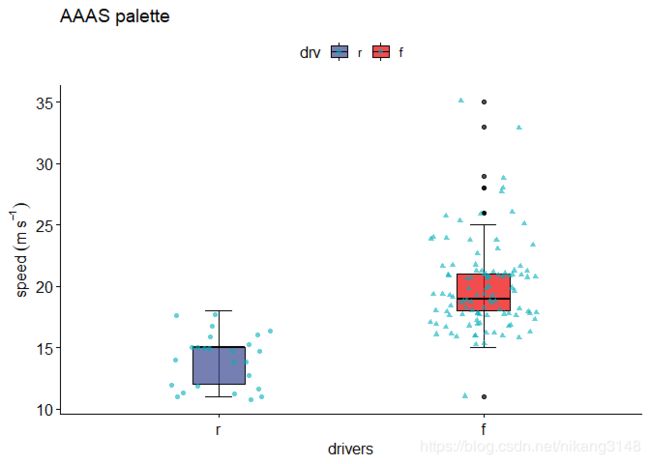
箱线图 ggboxplot()
ggboxplot(mpg, x = "drv", y = "cty",
          color = "black",
          fill="drv",
          palette ="aaas",
          width=0.2,
          alpha=0.7,
          # notch=T,
          # remove=c("4")
          select=c("f","r"),
          order=c("r","f"),
          add="jitter", #加散点
          add.params = list(shape="drv",color="#00AFBB",alpha=0.6),
          # label="fl",
          # font.label="bold",
          # label.select=list(top.up=10),
          # repel=T,
          # label.rectangle=T,
          bxp.errorbar=T,
          bxp.errorbar.width = 0.1,
          xlab="drivers",
          ylab=expression(speed~(m~s^-1)),
          title="AAAS palette",
          ggtheme=theme_pubr()
          )
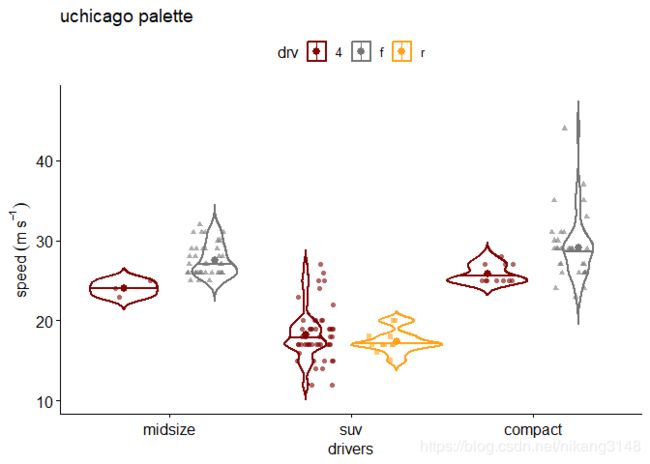
小提琴图 ggviolin
ggviolin(mpg,x="class",y="hwy",
         # remove=c("4")
         select=c("compact","suv","midsize"),
         order=c("midsize","suv","compact"),
         color = "drv",
         fill="NA",
         palette ="uchicago",
         alpha=0.7, #透明度
         linetype=1,
         trim=F,
         size=1,
         width=1, #violin width
         draw_quantiles = 0.5, #median value

         add=c("jitter","mean"), #加散点
         add.params = list(shape="drv",color="drv",alpha=0.6),
         error.plot = "errorbar",
         # label="fl",
         # font.label=c(size=11,color="black","bold"),
         # label.select=list(top.up=10),
         # repel=T,
         # label.rectangle=T,
         position=position_dodge(1),
         xlab="drivers",
         ylab=expression(speed~(m~s^-1)),
         title="uchicago palette",
         ggtheme=theme_pubr()
                  )
散点直方图(组合图形)ggscatterhist()
ggscatterhist(mpg,x="hwy",y="cty",
              color="drv",
              fill="drv",
              palette="material",
              shape=21,
              size=2,
              linetype = "solid",
              bins=30,
              margin.plot="boxplot",
              margin.params=list(color="drv",fill="NA"),
              margin.ggtheme=theme_light(),
              margin.space=F,
              main.plot.size=2,
              margin.plot.size=1,
              title="material palette",
              legend="right",
              ggtheme=theme_cleveland()
              )
Q-Q图(是否符合分布)ggqqplot()
ggqqplot(mpg,x="displ",
         color="drv",
         palette="locuszoom",
         size=2,
         shape=21,
         add="qqline",
         add.params = list(linetype = "solid",size=1,linetype=1),
         conf.int=T,
         conf.int.level=0.95,
         title="locuszoon palette"
         )
直方图 gghistogram()
gghistogram(mpg,x="hwy",y="..count..",
            color="NA",
            fill="drv",
            palette = "igv",
            size=1,
            linetype=1,
            alpha=0.5,
            bins=30, #柱子个数
            binwidth=0.8,
            title="igv palette",
            xlab="hwy",
            ylab="Count",
           # add="mean",
            add.params=list(size=1.5,linetype=1,color="drv"),
            rug=TRUE,
            add_density=T,
           #   label="drv",
            # font.label = list(size=14,face="italic",color="black"),
             # label.select="r",
             #repel=T,
              #label.rectangle=T,
            position=position_dodge(1)
)
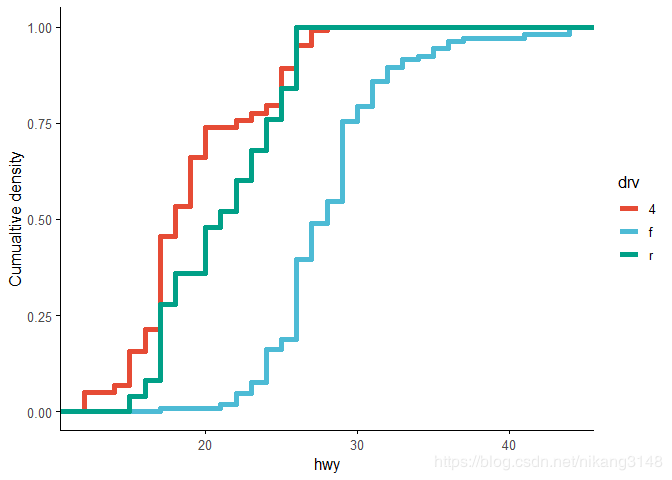
概率累积分布图
ggecdf(mpg,"hwy",
       color="drv",palette="npg",
       size=2,linetype=1,
       ylab="Cumualtive density",
       ggtheme=theme_classic2()
       )
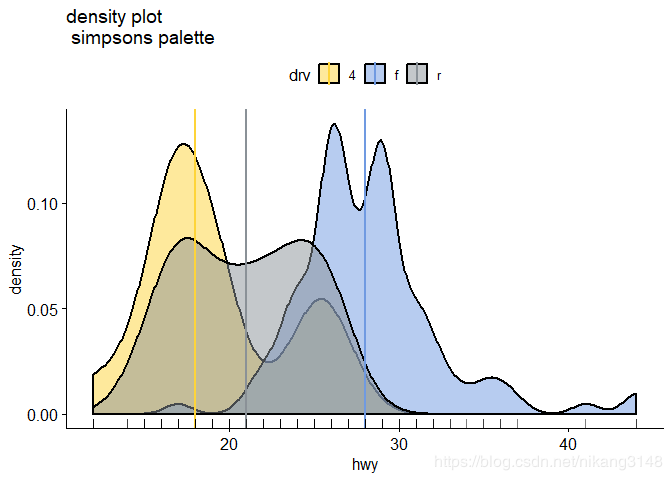
密度曲线图 ggdensity()
ggdensity(mpg,x="hwy",y="..density..",
          color="black",
          fill="drv",
          palette = "simpsons",
          size=1,
          linetype=1,
          alpha=0.5,

          title="density plot \n simpsons palette",
          xlab="hwy",
          ylab="density",
          add="median",
          add.params=list(size=1,linetype=1,color="drv"),
          rug=TRUE,
        #  label="drv",
         # font.label = list(size=14,face="italic",color="black"),
        #  label.select="r",
         # repel=T,
        #  label.rectangle=T,
          ggtheme=theme_pubr()

          )
累积分布曲线图
ggecdf(mpg,"hwy",
       color="drv",palette="npg",
       size=2,linetype=1,
       ylab="Cumualtive density",
       ggtheme=theme_classic2()
       )
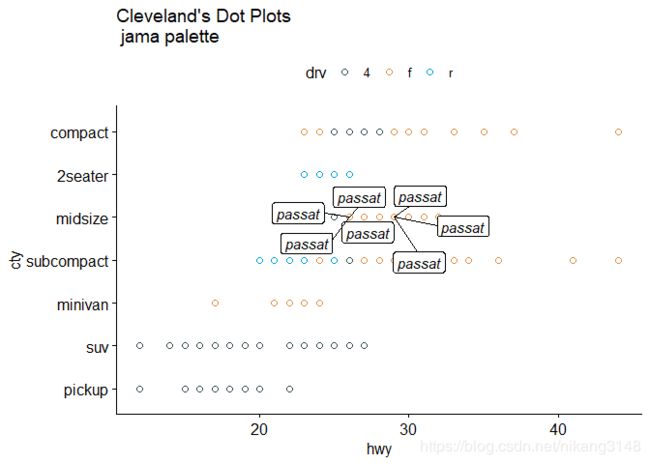
Cleveland点线图 ggdotchart()
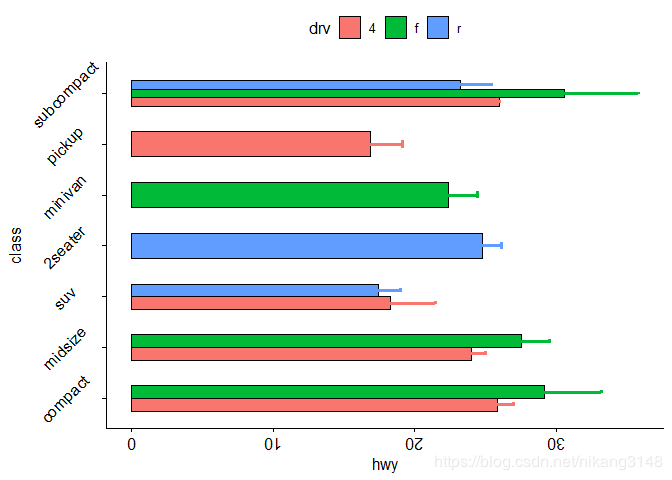
ggdotchart(mpg,x="class",y="hwy",
           color="drv",
           palette="jama",
           shape=21,
           size=4,
           dot.size=2,
           sorting="desc", #按照y排序
          # add="segments",
           add.params=list(size=1,linetype=2,color="red"),
           x.text.col=F,
           rotate=T,
           title="Cleveland's Dot Plots \n jama palette",
           xlab="cty",ylab="hwy",
           label="model",
           label.select="passat",
           font.label=list(size=12,face="italic",color="black"),
           label.rectangle=T,
           repel=T,
           position=position_dodge(0)
                  )
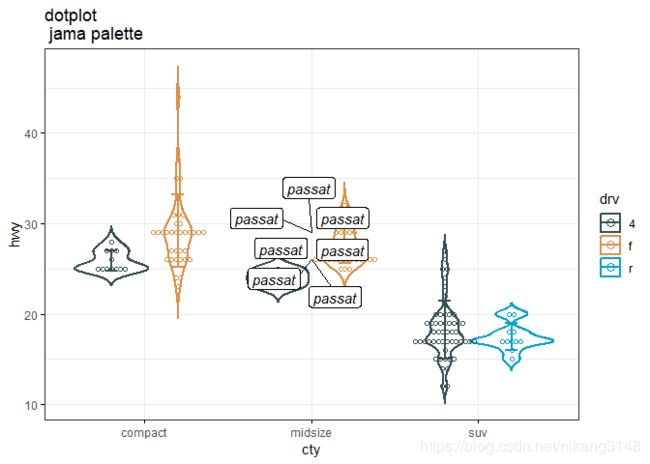
点图 ggdotplot()
ggdotplot(mpg,x="class",y="hwy",
          select=c("compact","midsize","suv"),
          color="drv",
          fill="NA",
          palette="jama",
           size=1,
           binwidth = 0.5,
           add=c("violin","mean_sd"),
           add.params=list(size=1,color="drv"),
          error.plot="errorbar",
           title="dotplot \n jama palette",
           xlab="cty",ylab="hwy",
           label="model",
           label.select="passat",
           font.label=list(size=12,face="italic",color="black"),
           label.rectangle=T,
           repel=T,
          ggtheme=theme_bw()
)
统计变换图 stat_transform
统计变换图则是在统计变换基础上,进行数据可视化,一般不直接呈现原始数据,多求取数据平均值、方差,显示数据离散及组件差异。主要形式是根据数据是否离散或者连续,进行绘制:
- 散点图 连续x-y,还有分组变量
- 点线图 连续x-y
- 柱状图 x多为分类变量
- 饼图
- 牛眼图
- 气泡图
- 误差图
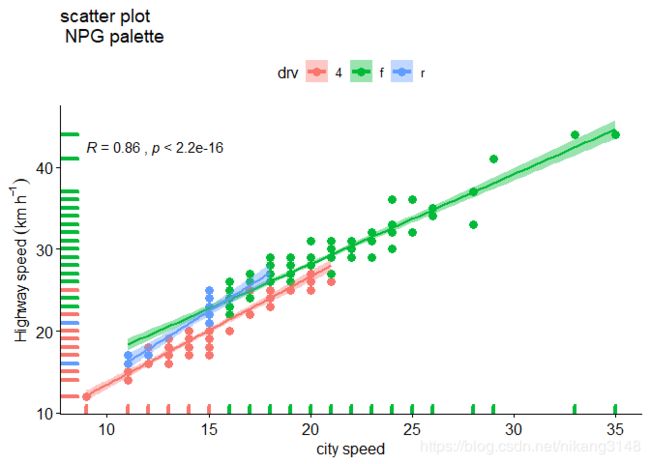
散点图 scatter plot
ggscatter(mpg,x="cty",y="hwy",
         color="drv", #边线颜色
         # fill="drv", #填充色
         palette = "NPG",
         # shape="fl", #点形状
         size=3, #点大小
         # point=F, #控制是否显示点
          rug=T, #可以看y数据分布趋势
         title="scatter plot \n NPG palette",
         xlab="city speed",
         ylab=expression(Highway~speed~(km~h^-1)),
         # facet.by="fl",#分面
         add="reg.line", #fitting line (reg.line, loess)
         add.params=list(color="drv",size=1),
         conf.int=T,
         conf.int.level=0.95,
         # ellipse=T,
         # ellipse.level=0.95,
         # ellipse.type="t",
         # ellipse.alpha=0.3,
         # ellipse.border.remove=T,
         # mean.point=T,
         # mean.point.size=10,
         # star.plot=T,
         # star,plot.lty=1,
         # star.plot.lwd=2,
         # label="fl",
         # font.label="bold",
         # font.family="serif",
         # repel=T,
         # label.rectangle=T,
         cor.coef=T,
         # coef.coeff.args=list(method="pearson"),#参考stat_cor()
         cor.method="kendall",
         # cor.coef.coord=c(20.5,40.5) #标签位置
         # cor.coef.size=10,
         # ggp=NULL, #添加到已有图
         # show.legend.text=FALSE
         ggtheme=theme_pubr()
         )
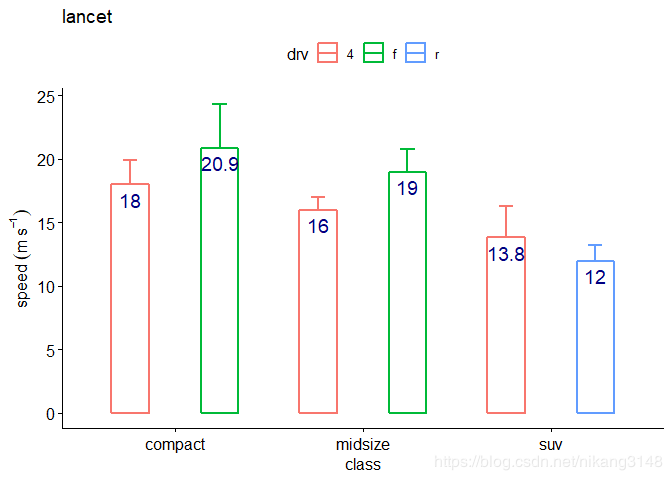
柱状图 ggbarplot()
ggbarplot(mpg, x="class", y="cty",
          # merge=T,
           select=c("compact","suv","midsize"),
          # remove=c("suv","pickup"),
          # order=c("midsize","compact"),#定义x排序
          color="drv",#边线颜色
          fill="NA",#映射填充色
          palette ="bar plot \n lancet palette",#
          size=1.05,
          width=0.4, #bar宽度
          add=c("mean_sd"),#添加误差线或其它
          error.plot = c("upper_errorbar"),#误差线样式
          add.params = list(color="drv",size=1.05),
          label=T,
          lab.col="navyblue",
          lab.size=5,
          lab.pos="in",
          lab.vjust=1.5,
          # lab.hjust=0.5,
          lab.nb.digits=1,#小数位数
          # sort.val="desc",#根据y值排序,但是x需要唯一
          # sort.by.groups=F,
          # top=2,#只显示最高的2个
          position=position_dodge(),
          orientation = "vertical",
          title="lancet",
          xlab="class",
          ylab=expression(speed~(m~s^-1))
          )
点线图 ggline()
ggline(mpg,x="class",y="hwy",
       color="drv",
       palette="jco",
       linetype="drv",
       plot_type="b",#c(b,l,p)
       size=1.2,
       shape=19,
       point.size=3,
       # point.color="drv",
       title="line chart \n JCO palette",
       xlab="class",
       ylab="highway speed",
       # select=c(""),
       # remove=c(),
       # order=
       add=c("mean_se"),
       add.params=list(size=1.1),
       error.plot = "errorbar",
       # label="model",
       #font.label="bold",
       #label.select=list(top.up = 10, top.down = 4),
       # repl=T,
       #label.rectangle=T,
       # show.line.label=T,
       ggtheme=theme_pubr()
       )
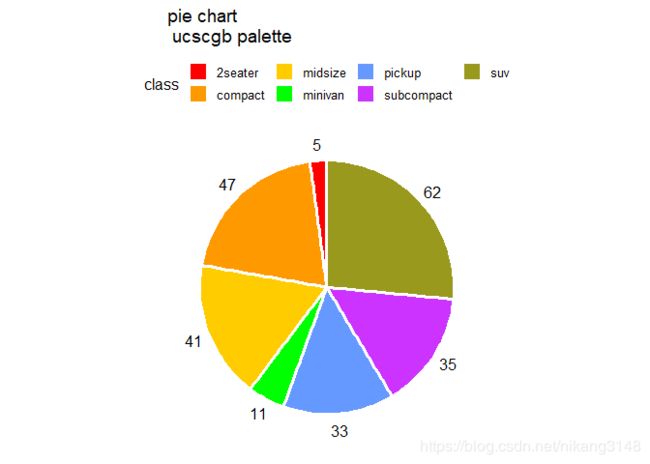
饼图(pie)
饼图需要单一数据格式,ggpie不具有变换功能,因为ggplot2中需要极坐标转换。
aggregate(hwy~class,mpg,length)%>%ggpie(x="hwy",
      label="hwy",
      lab.pos="out",
      lab.adjust=1,
      lab.font=c(4,"bold","red"),
      font.family="serif",
      color="white",
      fill="class",
      palette = "ucscgb",
      size=1.2,
      title="pie chart \n ucscgb palette"
)
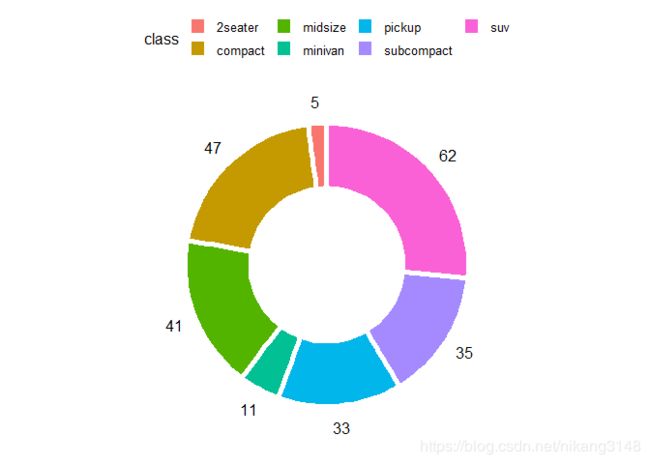
牛眼图(donutchart)
aggregate(hwy~class,mpg,length)%>%
ggdonutchart(x="hwy",
             label="hwy",
             lab.pos="out",
             lab.adjust=0.5,
             lab.font=c(size=6,face="italic",color="black"),
             font.family="mono",
             color="white",
             fill="class",
             palette="donut chart \n rickandmorty",
             size=2
             )
气泡图 bublle plot
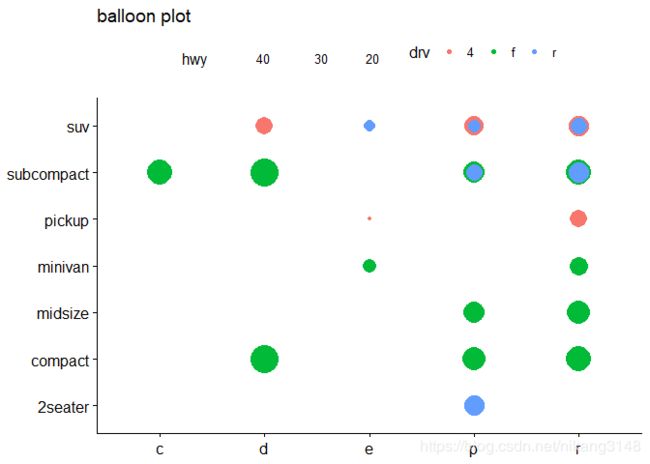
气泡图用点图直径表示数据大小,可将三维数据二维化。需要格式化数据,ggballonplot没有统计变换功能。
aggregate(hwy~fl+class+drv,mpg,max)%>%
  ggballoonplot(x="fl",y="class",size="hwy",
              size.range=c(1,10),
              shape=21,
              color="NA",
              fill="drv",
              #show.label=T,
              #font.label=list(size=12,face="italic",color="black"),
              rotate.x.text=F,
              title="balloon plot",
              ggtheme = theme_pubr()
              )
误差图 errorplot
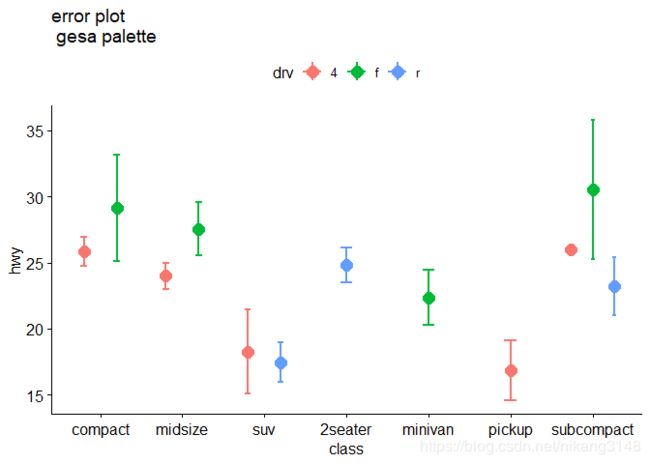
ggerrorplot(mpg,x="class",y="hwy",
            desc_stat="mean_sd", #核心参数
            color="drv",
            palette="gesa",
            size=1,
            width=0.2,
            title="error plot \n gesa palette",
            xlab="class",ylab="hwy",
            add=c("mean"),
            add.params=list(size=1,shape=19,color="drv",fill="white"),
            error.plot="errorbar",
            ci=0.95,
            position=position_dodge(0.8)
)
特殊数据图 special plot
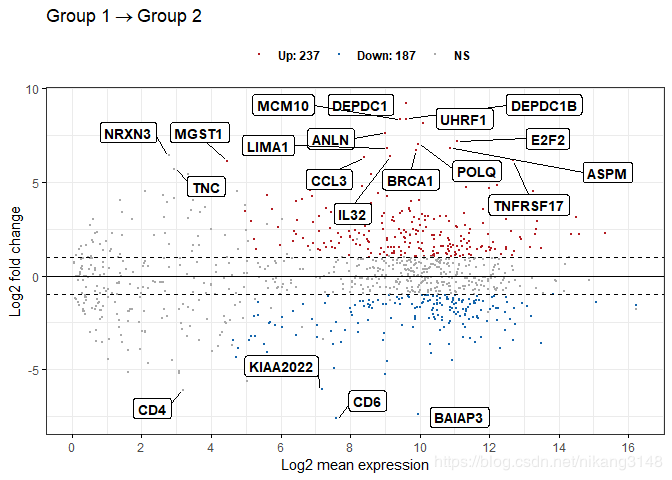
差异表达数据 MA-plot
数据文件至少要包含:
- name: 基因名称
- baseMean: the mean expression of genes in the two groups.
- log2FoldChange: the log2 fold changes of group 2 compared to group 1
- padj: the adjusted p-value of the used statiscal test.
ggmaplot(diff_express[1:1000,], main = expression("Group 1" %->% "Group 2"),
         fdr = 0.05, fc = 2, size = 0.4,
         palette = c("#B31B21", "#1465AC", "darkgray"),
         genenames = as.vector(diff_express[1:1000,]$name),
         legend = "top",
         top = 20, #筛选显著20个基因
         select.top.method="fc", #最大fold
         font.label = c("bold", 11), label.rectangle = TRUE,
         font.legend = "bold",
         font.main = "bold",
         ggtheme = ggplot2::theme_bw())
配对比较图 paired data plot
用于配对比较处理前后或者有无处理的差别。
ggpaired(mpg,
         cond1="cty",cond2="hwy",
         #  x="group",y="values", #x为分组变量,y为观测值
         id="model",
         color="condition",
         #  fill="condition",
         palette="npg",
         width=0.5,
         point.size=1,
         line.size=0.5,
         line.color = "gray",
         repel=T
)
绘制表格
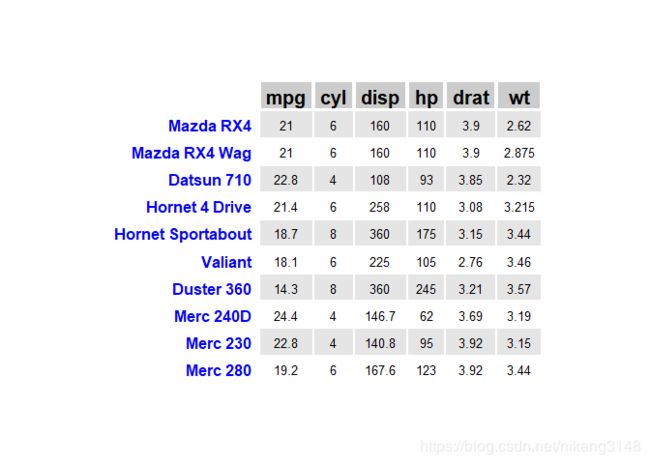
table1<-ggtexttable(mtcars[1:10,1:6],
           theme= ttheme(# "minimal",base_size=10,base_colour="red" #非“default"下自定义无效,
                        colnames.style=colnames_style(size=15,color="black",
                                                      face="bold",fill="grey80",
                                                      linewidth=4,linecolor="white"
                                                      ),
                        rownames.style=rownames_style(color="blue",face="bold"),
                        tbody.style=tbody_style(size=10,color="black",face="plain",
                                                fill=c("grey90","white"),#可色板
                                                linewidth=2,linecolor="white",
                                                #  hjust=0,x=0.1
                                                #Left:hjust=0, x=0.1 Right:hjust=1, x=0.9
                                                )
                           )
)
table1
table1%>%table_cell_font(row=5,column = 3,face="bold.italic",size=15)%>%#修改表格单元格字体
table_cell_bg(row=5,column = 3,fill="yellow",color="red",linewidth=8)#修改表格单元格颜色
文字画
ggparagraph(paste(rep("I have a dream",10),collapse=","),
            color="red",size=12,face="bold",family="serif",
            lineheight=1 #行距
            )
text_grob(paste(rep("I have a dream",10),collapse=","),
          face = "italic", color = "steelblue",size=20,lineheight=1,family="serif",
          rot=45) %>%as_ggplot()
图形调整
图形组合 arrange
p1<-ggscatter(mpg,"hwy","cty",color="drv",add="reg.line",shape=21)+theme_bw()
p2<-ggbarplot(mpg,"class","hwy",fill="drv",width=0.5,
          add="mean_sd",add.params = list(color="drv",size=1.2),
          position=position_dodge(0.5))
p3<-ggarrange(p1,p2,ncol=2,nrow=1,
               widths=c(1,1), #图形宽度
               align="h",
               labels=list("(a)","(b)"),
               vjust=2,hjust=-3,
               legend=c(0.5,0.8),
               common.legend = F)
p3
更改参数
格式调整ggpar
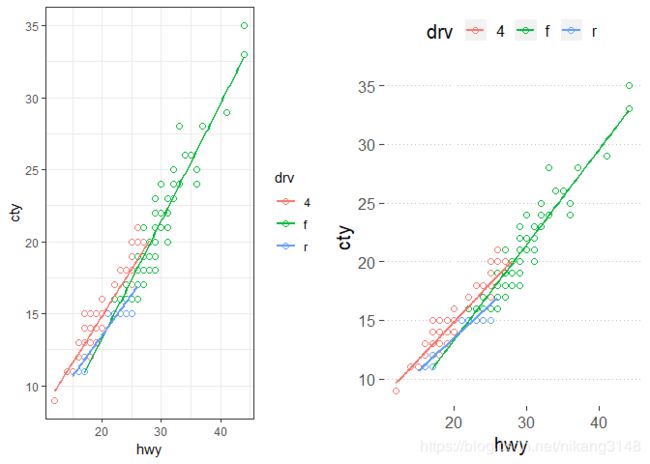
ggarrange(p1,
  ggpar(p1,palette="jco",
      # gradient.cols=get_palette("npg",5),#自定义色板
      main="main",submain="submain",
      # title="title",subtitle="subtitle", 与main一致
      caption="caption",
      xlab="xlab",ylab="ylab",
      font.main=c(size=14,style="bold",color="red"),
      font.x=c(size=14,style="bold",color="red"),
      font.family="serif",
      xlim=c(10,50),ylim=c(15,30),
      xscale="none",yscale="none",format.scale = F,
      legend="top",legend.title="drivers",font.legend=c(10,"bold","black"),
      ticks=T,tickslab = T,
      font.ticklab=c(10,"bold","black"),
      #  font.xtickslab = c(10,"bold","black"),
      #  font.ytickslab = c(10,"bold","black"),
      x.text.angle=45,y.text.angle = 45,
      xticks.by = 5,
      # yticks.by = 5, #刻度线间隔数值every 5,不能同时xy调整
      # rotate=T, #coord-flip()
      # orientation = "vertical",#y倒叙
      ggtheme=theme_bw()
          )
      )
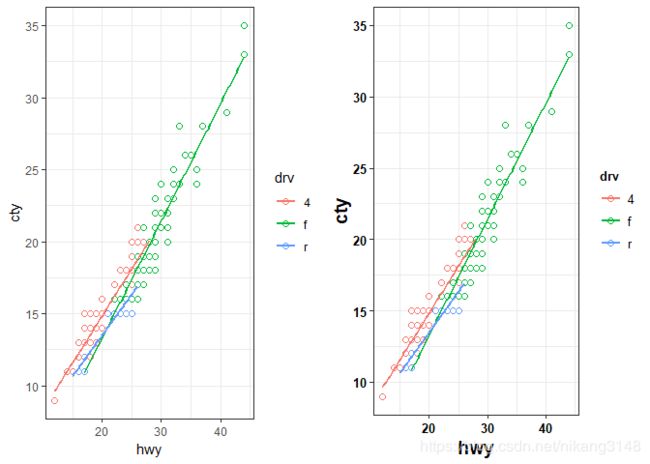
标签字体
p1+font(object="ylab",#title,caption,legend.text,xylab,xy.text
        size=20,color="red",
        face="bold",family="serif") #element_text()参数均可
对图形进行修饰annotate
annotate_figure(p3,
                top="Figures Combination",
                bottom=text_grob("data source",color="red"),
                left="Left label",
                right="right label",
                fig.lab="Figure 1",
                fig.lab.pos="top.left",
                fig.lab.size=20,
                fig.lab.face = "italic"
)
改变坐标轴尺度xscale(), yscale()
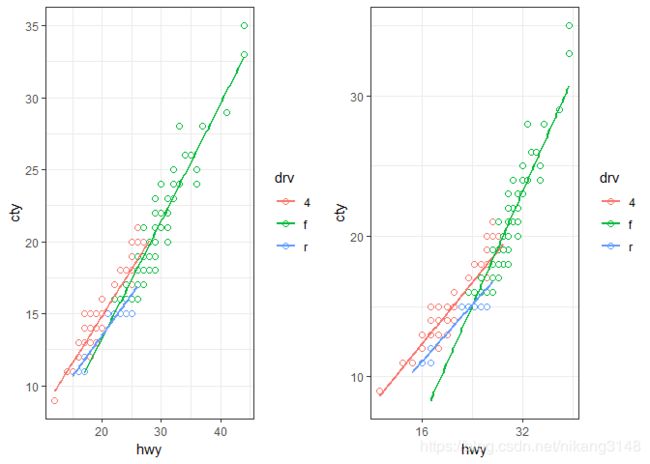
ggarrange(p1,p1+xscale("log2",F))
改变作图区背景色
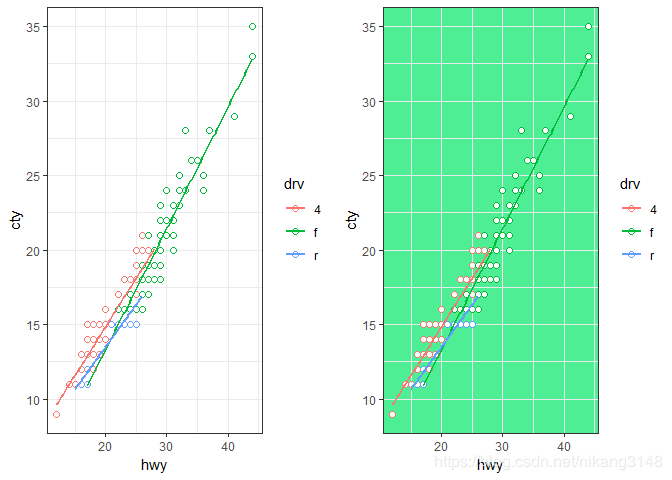
ggarrange(p1,p1+bgcolor("seagreen2"))
设置图区边线 border()
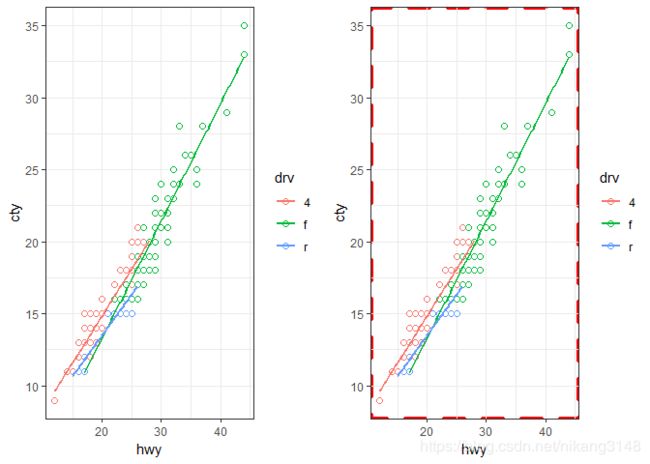
ggarrange(p1,
	p1+border(color="red",size=2,linetype=2))
设置调整调色板
# color_palette("palette_name") #设置color色板
# fill_palette("palette_name") #设置fill色板
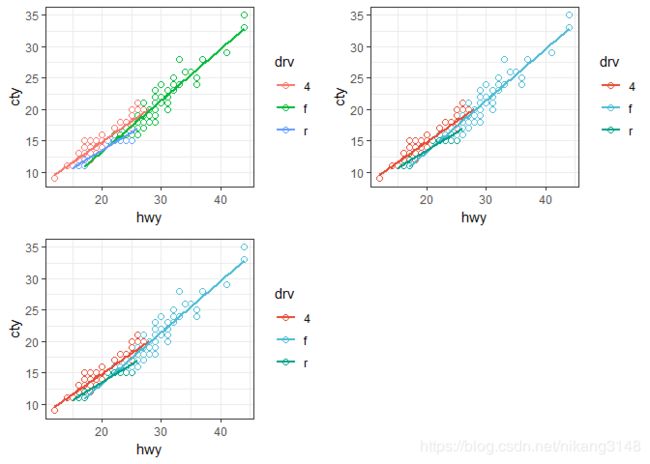
ggarrange(p1,
	set_palette(p1,"npg"),
	change_palette(p1,"npg")
	) #更改色板
主题相关
ggarrange(p1,p1+clean_theme()) #去除坐标轴相关内容
ggarrange(p1,p1+theme_pubclean(base_size=15,flip=F)) #去除坐标轴线
ggarrange(p1,p1+labs_pubr()) #对标签进行格式化
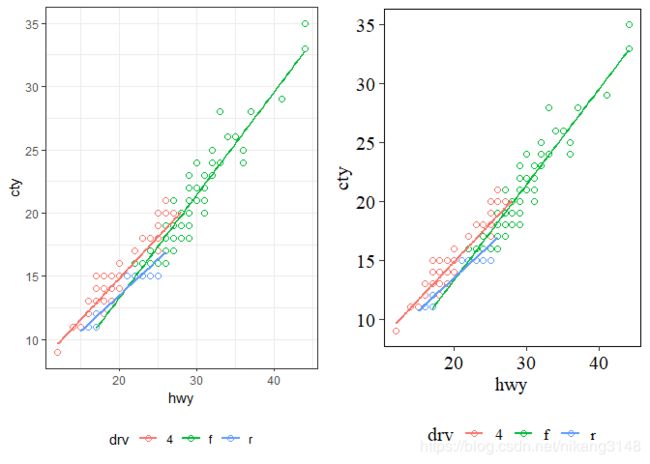
ggarrange(p1,
				p1+theme_pubr(base_size=15,border=T,base_family = "serif"),
				legend="bottom")
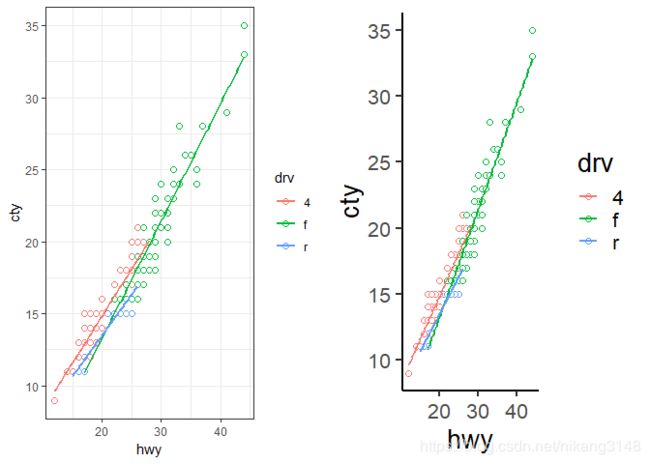
ggarrange(p1,
		p1+theme_classic2(base_size=20))
旋转
#旋转rotate
p2+
  rotate()+ #坐标轴反转,类似corrd_flip()
  # rotate_axis_text()
  rotate_x_text(angle=180,hjust=.5,vjust=1)+
  rotate_y_text(angle=45,hjust=0.5,vjust=0.5) #刻度线文字反转
添加元素
增加网格线add gridlines
p1+theme_pubr()+grids("xy",color="red",size=1,linetype=2)
增加分面
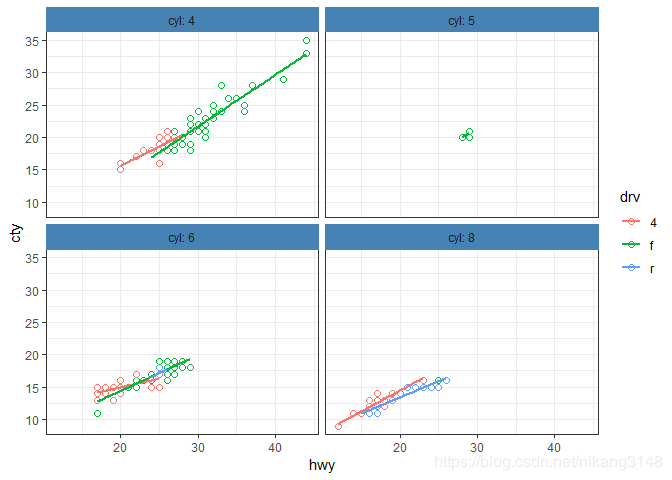
facet(p1,facet.by="cyl",
      short.panel.labs = F,   # Allow long labels in panels
      panel.labs.background = list(fill = "steelblue", color = "steelblue"))
增加文字标签
ggtext(mpg,"hwy","cty",
       color="drv",palette="npg",face="bold",family="sans",
       label="fl",repel=F,
       label.select="r",label.rectangle = T,
       show.legend = T,grouping.vars = "displ",
       position=position_jitter(0.2),
       ggp=p2, #add to p2, or NULL
       ggtheme=theme_bw()
       )
在已有图形上增加辅助统计量se,sd等
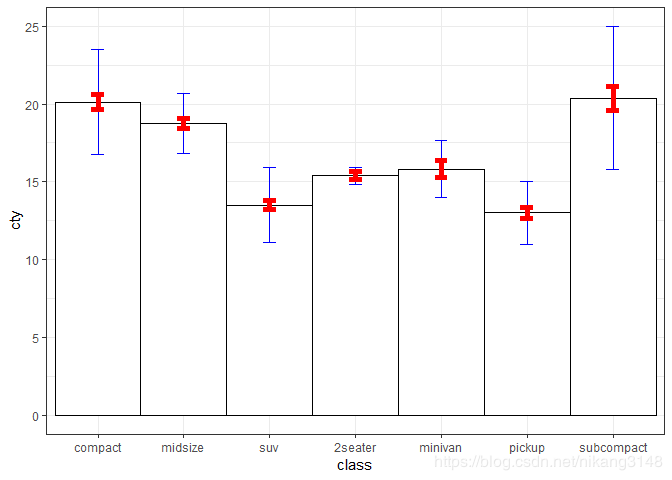
p4<-ggbarplot(mpg, x="class", y="cty",
          add="mean_sd",
          add.params=list(color="blue"),
          width=1
          )
add_summary(p4,"mean_se",error.plot="errorbar",
            color="red",fill="NA",
            group=1,width=0.2,
            shape=19,size=2,ci=0.95,
            data=NULL,
            position=position_dodge(0.8)
            )+theme_bw()
添加置信区间换图
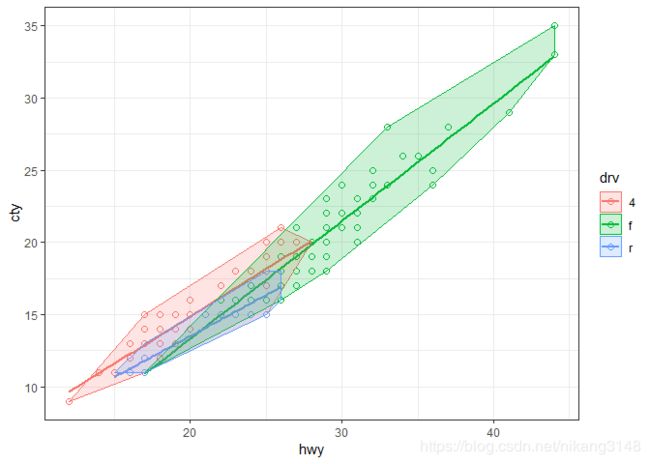
p1+stat_chull(aes(color=drv,fill=drv),geom="polygon",alpha=0.2)
p1+stat_stars(aes(color=drv))
p1+stat_conf_ellipse(aes(color=drv,fill=drv),geom="polygon",alpha=0.2)
图上添加统计结果
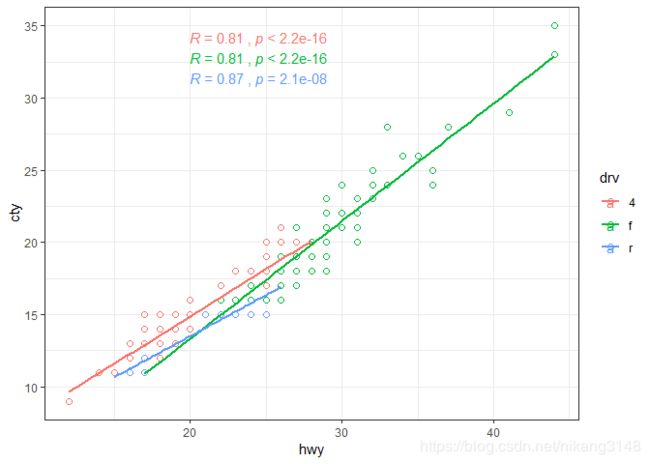
p1+stat_cor(method="kendall",aes(color=drv),label.x=20) #添加相关分析结果及p-value
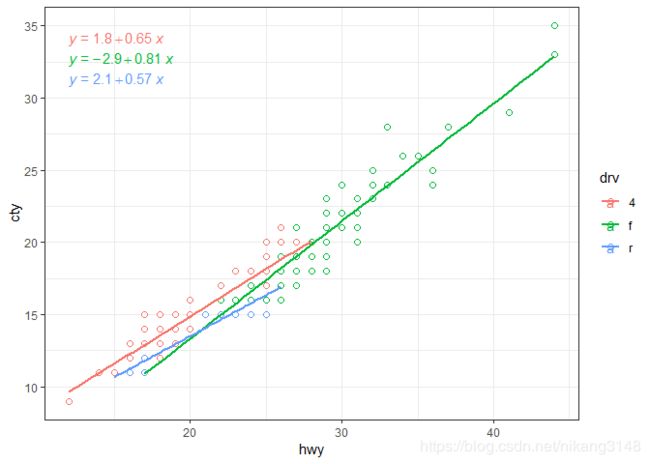
p1+stat_regline_equation(aes(group=drv,color=drv),formula=y~x) #添加回归线方程
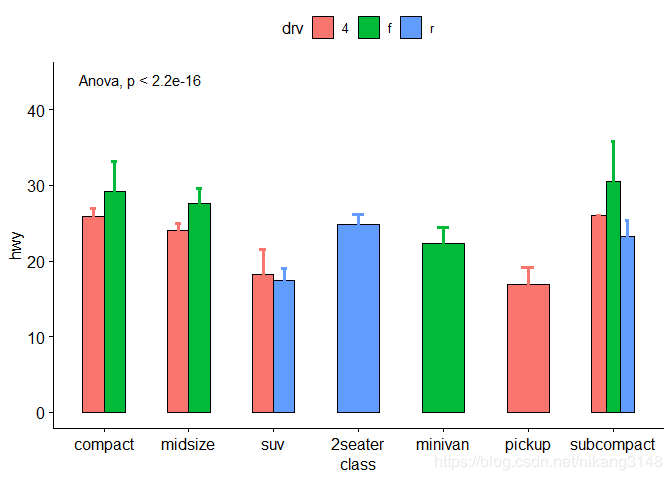
p2+stat_compare_means(method="anova") #添加ANOVA显著性数值p-value
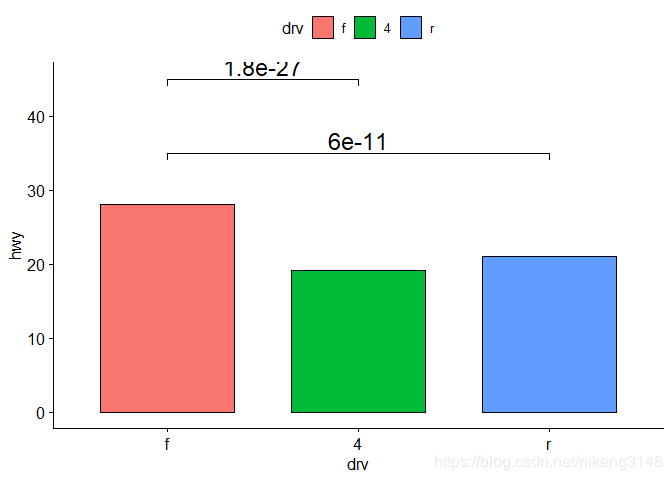
ggbarplot(mpg,"drv","hwy",add="mean",fill="drv")+
  compare_means(hwy~drv,mpg,paired=F,ref.group ="f")%>%
    mutate(y.position = c(45, 35))%>%
    stat_pvalue_manual(label = "p.adj", label.size=6)#手动添加p-value
添加元素
ggadd(p2,add=c("mean_sd","jitter"),color="drv",fill="drv",group=1,
      width=1,shape=21,size=3,alpha=0.6,
      jitter=0.2,binwidth=1,dotsize=1,error.plot="errorbar",
      ci=0.95,position=position_dodge(1),
      p_geom=""
            )
删除元素
ggarrange(p1,p1+rremove(object="grid"))
#"xy.grid" for both x and y grids
#"axis" x.axis
#"xylab", "xy.title" or "axis.title" for both x and y axis labels
#"xy.text" or "axis.text" for both x and y axis texts
# "ticks" "x.ticks"
#"legend.title" for the legend title
#"legend" for the legend
统计数据输出
均值比较
compare_means(hwy~1,mpg,mu=100,method="wilcox.test") #wilcox检验或者t.test
## # A tibble: 1 x 8
##   .y.   group1 group2            p    p.adj p.format p.signif method
##
## 1 hwy        1 null model 3.33e-40 3.30e-40 <2e-16   ****     Wilcoxon
compare_means(hwy~cyl,mpg,paired=F,method="t.test",ref.group = ".all.") #against all 比较
## # A tibble: 4 x 8
##   .y.   group1 group2        p    p.adj p.format p.signif method
##
## 1 hwy   .all.  4      9.28e-15 2.80e-14 9.3e-15  ****     T-test
## 2 hwy   .all.  6      2.79e- 1 2.80e- 1 0.28     ns       T-test
## 3 hwy   .all.  8      3.43e-21 1.40e-20 < 2e-16  ****     T-test
## 4 hwy   .all.  5      5.21e-13 1.00e-12 5.2e-13  ****     T-test
compare_means(hwy~cyl,mpg,paired=F,method="wilcox.test",ref.group = NULL) #pairwise比较
## # A tibble: 6 x 8
##   .y.   group1 group2        p    p.adj p.format p.signif method
##
## 1 hwy   4      6      3.30e-16 1.60e-15 3.3e-16  ****     Wilcoxon
## 2 hwy   4      8      1.47e-24 8.80e-24 < 2e-16  ****     Wilcoxon
## 3 hwy   4      5      8.18e- 1 8.20e- 1 0.81763  ns       Wilcoxon
## 4 hwy   6      8      2.37e-13 9.50e-13 2.4e-13  ****     Wilcoxon
## 5 hwy   6      5      9.80e- 4 2.30e- 3 0.00098  ***      Wilcoxon
## 6 hwy   8      5      7.56e- 4 2.30e- 3 0.00076  ***      Wilcoxon
compare_means(hwy~cyl,mpg,paired=F,method="t.test",ref.group = "4") #against参考组pairwise比较
## # A tibble: 3 x 8
##   .y.   group1 group2        p    p.adj p.format p.signif method
##
## 1 hwy   4      6      2.67e-16 5.30e-16 2.7e-16  ****     T-test
## 2 hwy   4      8      9.60e-38 2.90e-37 < 2e-16  ****     T-test
## 3 hwy   4      5      9.26e- 1 9.30e- 1 0.93     ns       T-test
compare_means(hwy~cyl,mpg,paired=F,method="anova",ref.group=NULL) #方差模型
## # A tibble: 1 x 6
##   .y.          p    p.adj p.format p.signif method
##
## 1 hwy   9.98e-44 1.00e-43 <2e-16   ****     Anova
compare_means(hwy~cyl,mpg,paired=F,method="kruskal.test") #非参检验
## # A tibble: 1 x 6
##   .y.          p    p.adj p.format p.signif method
##
## 1 hwy   4.86e-32 4.90e-32 <2e-16   ****     Kruskal-Wallis
compare_means(hwy~cyl,mpg,paired=F,ref.group = "4",group.by="drv") #分组pairwise比较
## # A tibble: 5 x 9
##   drv   .y.   group1 group2        p    p.adj p.format p.signif method
##
## 1 f     hwy   4      6      5.87e-14 2.90e-13 5.9e-14  ****     Wilcoxon
## 2 f     hwy   4      8      1.01e- 1 2.00e- 1 0.10     ns       Wilcoxon
## 3 f     hwy   4      5      3.27e- 1 3.30e- 1 0.33     ns       Wilcoxon
## 4 4     hwy   4      6      2.03e- 7 6.10e- 7 2.0e-07  ****     Wilcoxon
## 5 4     hwy   4      8      1.50e-11 6.00e-11 1.5e-11  ****     Wilcoxon
compare_means(hwy~cyl,mpg,paired=F,ref.group = ".all.",group.by="drv") #分组pairwise比较
## # A tibble: 9 x 9
##   drv   .y.   group1 group2           p     p.adj p.format p.signif method
##
## 1 f     hwy   .all.  4          6.88e-5   4.10e-4 6.9e-05  ****     Wilcox~
## 2 f     hwy   .all.  6          8.55e-7   6.80e-6 8.6e-07  ****     Wilcox~
## 3 f     hwy   .all.  8          2.66e-1   1.00e+0 0.266    ns       Wilcox~
## 4 f     hwy   .all.  5          4.24e-1   1.00e+0 0.424    ns       Wilcox~
## 5 4     hwy   .all.  4          7.11e-8   6.40e-7 7.1e-08  ****     Wilcox~
## 6 4     hwy   .all.  6          3.48e-1   1.00e+0 0.348    ns       Wilcox~
## 7 4     hwy   .all.  8          3.34e-5   2.30e-4 3.3e-05  ****     Wilcox~
## 8 r     hwy   .all.  6          3.26e-2   1.60e-1 0.033    *        Wilcox~
## 9 r     hwy   .all.  8          4.56e-1   1.00e+0 0.456    ns       Wilcox~
compare_means(hwy~cyl,mpg,paired=F,ref.group = NULL,group.by="drv")
## # A tibble: 10 x 9
##    drv   .y.   group1 group2        p    p.adj p.format p.signif method
##
##  1 f     hwy   4      6      5.87e-14 5.90e-13 5.9e-14  ****     Wilcoxon
##  2 f     hwy   4      8      1.01e- 1 4.00e- 1 0.1007   ns       Wilcoxon
##  3 f     hwy   4      5      3.27e- 1 7.10e- 1 0.3267   ns       Wilcoxon
##  4 f     hwy   6      8      7.45e- 1 7.40e- 1 0.7446   ns       Wilcoxon
##  5 f     hwy   6      5      1.40e- 3 8.40e- 3 0.0014   **       Wilcoxon
##  6 f     hwy   8      5      2.36e- 1 7.10e- 1 0.2357   ns       Wilcoxon
##  7 4     hwy   4      6      2.03e- 7 1.60e- 6 2.0e-07  ****     Wilcoxon
##  8 4     hwy   4      8      1.50e-11 1.40e-10 1.5e-11  ****     Wilcoxon
##  9 4     hwy   6      8      1.50e- 6 1.00e- 5 1.5e-06  ****     Wilcoxon
## 10 r     hwy   6      8      1.23e- 2 6.20e- 2 0.0123   *        Wilcoxon
分组描述统计desc_statby()
desc_statby(mpg,"hwy",c("drv","cyl"),ci=0.95)
## Warning in stats::qt(ci/2 + 0.5, data_sum$length - 1): 产生了NaNs
##   drv cyl length min max median     mean  iqr    mad        sd        se
## 1   4   4     23  20  28   25.0 24.60870 2.50 1.4826 2.5359081 0.5287734
## 2   4   6     32  17  25   19.0 19.50000 3.00 2.9652 2.8960485 0.5119539
## 3   4   8     48  12  23   17.0 16.35417 3.00 1.4826 2.2168560 0.3199756
## 4   f   4     58  24  44   29.0 30.46552 2.75 2.9652 4.0271688 0.5287932
## 5   f   5      4  28  29   29.0 28.75000 0.25 0.0000 0.5000000 0.2500000
## 6   f   6     43  17  29   26.0 25.06977 2.00 1.4826 2.1973507 0.3350928
## 7   f   8      1  25  25   25.0 25.00000 0.00 0.0000        NA        NA
## 8   r   6      4  24  26   25.5 25.25000 1.25 0.7413 0.9574271 0.4787136
## 9   r   8     21  15  26   20.0 20.19048 6.00 4.4478 3.4149531 0.7452039
##          ci range         cv        var
## 1 1.0966089     8 0.10304927  6.4308300
## 2 1.0441368     8 0.14851531  8.3870968
## 3 0.6437079    11 0.13555298  4.9144504
## 4 1.0588901    20 0.13218777 16.2180883
## 5 0.7956116     1 0.01739130  0.2500000
## 6 0.6762447    12 0.08764942  4.8283499
## 7       NaN     0         NA         NA
## 8 1.5234802     2 0.03791791  0.9166667
## 9 1.5544680    11 0.16913683 11.6619048
元素输出
执行ggplot函数
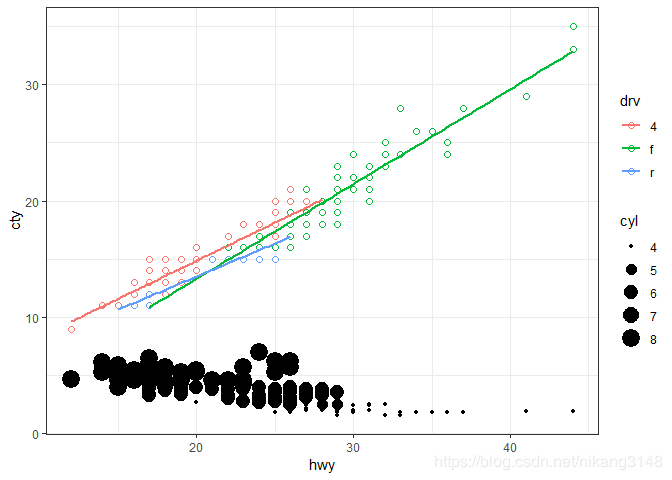
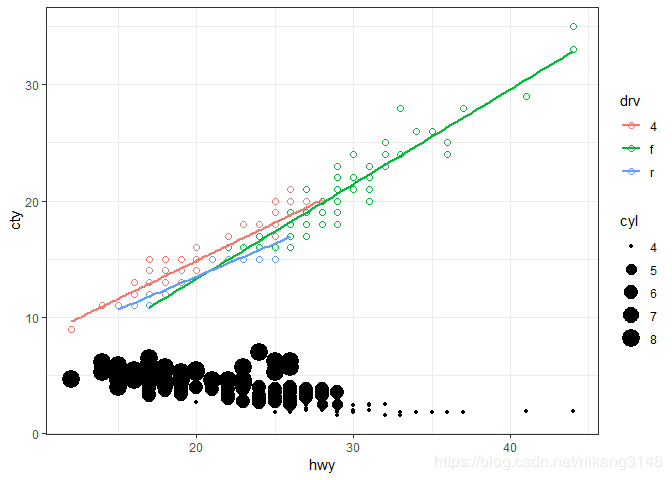
p1+geom_exec(geom_point, data = mpg, #geom_** functions
                     x = "hwy", y = "displ", size = "cyl",)
p1+geom_point(aes(hwy,displ,size=cyl),data=mpg)
图例输出
#get legend
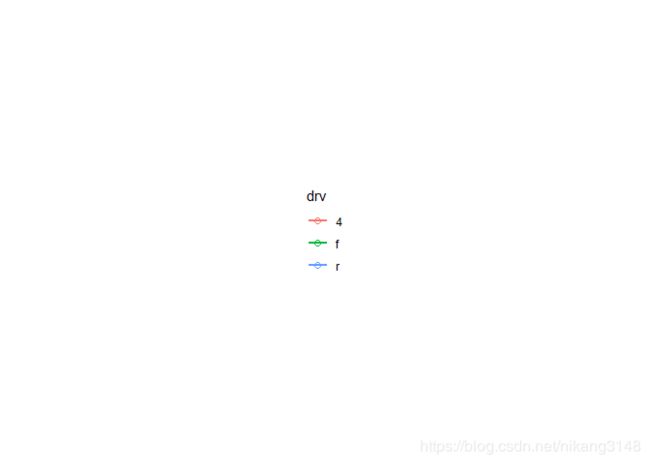
p1%>%get_legend()%>%as_ggplot()
点线形式输出
#show point and line type
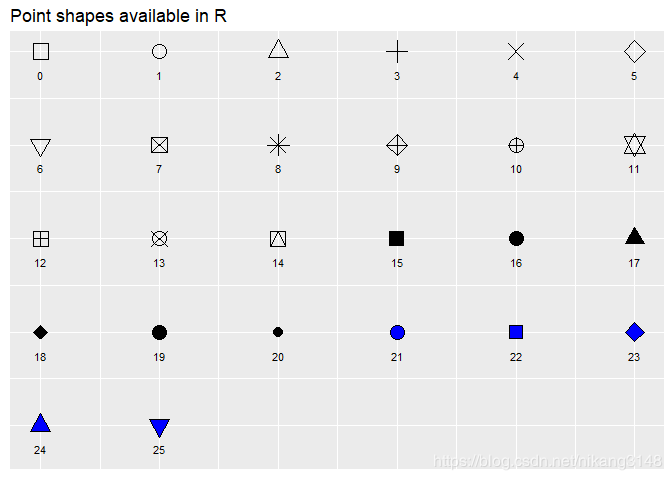
show_point_shapes()
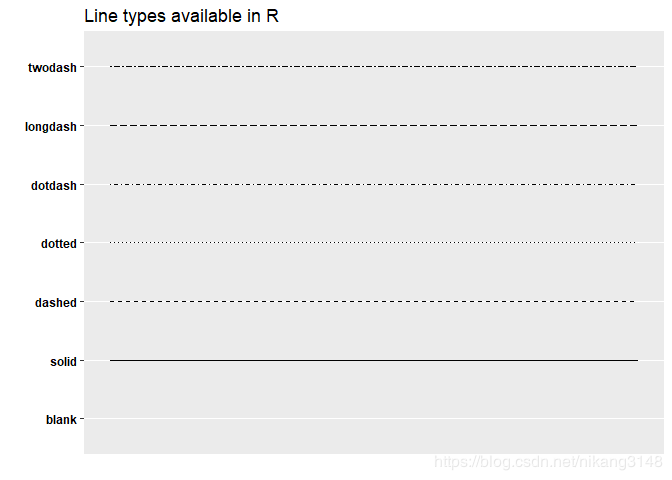
show_line_types()
调色板输出get palette
get_palette("npg", 3) #生成色板中3个过渡色
## [1] "#E64B35FF" "#4DBBD5FF" "#00A087FF"
