R语言高级图像处理
- 大数据部落
- 数据分析
- 小波滤波器
- 算法
- 数据分析报告代写
- CS作业代写
- C代写
- C++代写
- 代写Computer
- science
- assignment
- R语言代写
- python代写
- 数据库代写
- 数据科学Computer
- Science报告代写
- 元分析
- 数据挖掘代写
- Computer
- science代写
原文http://tecdat.cn/?p=3431
ImageMagick的库具有大量功能.Magick的当前版本暴露了相当大的一部分,但作为第一个版本,文档仍然很少。本文简要介绍了最重要的入门概念。
安装 magick
在的Windows或OS-X上,通过CRAN最容易安装软件包。
install.packages("magick")二进制CRAN包开箱即用,并启用了最重要的功能。使用magick_config哪些功能格式状语从句:由您的ImageMagick的的版本支持。
library(magick)## Linking to ImageMagick 6.9.9.39
## Enabled features: cairo, fontconfig, freetype, lcms, pango, rsvg, webp
## Disabled features: fftw, ghostscript, x11str(magick::magick_config())## List of 21
## $ version :Class 'numeric_version' hidden list of 1
## ..$ : int [1:4] 6 9 9 39
## $ modules : logi FALSE
## $ cairo : logi TRUE
## $ fontconfig : logi TRUE
## $ freetype : logi TRUE
## $ fftw : logi FALSE
## $ ghostscript : logi FALSE
## $ jpeg : logi TRUE
## $ lcms : logi TRUE
## $ libopenjp2 : logi TRUE
## $ lzma : logi TRUE
## $ pangocairo : logi TRUE
## $ pango : logi TRUE
## $ png : logi TRUE
## $ rsvg : logi TRUE
## $ tiff : logi TRUE
## $ webp : logi TRUE
## $ wmf : logi FALSE
## $ x11 : logi FALSE
## $ xml : logi TRUE
## $ zero-configuration: logi TRUE从源头构建
sudo apt-get install libmagick++-devsudo yum install ImageMagick-c++-devel要在OS-X上从源代码安装,需要您imagemagick@6自制软件。
brew reinstall imagemagick@6 --with-fontconfig --with-librsvg
brew link --force imagemagick@6自制软件中的默认imagemagick配置会禁用一系列功能。建议至少酿造--with-fontconfig并--with-librsvg支持高质量的字体/ svg渲染(CRAN OSX二进制包也支持这些)。
图像IO
是什么让magick如此神奇,它会自动转换并呈现所有常见的图像格式.ImageMagick支持许多格式并自动检测类型。使用magick::magick_config()列出您的ImageMagick的的版本支持的格式。
读和写
可以使用带有图像数据的文件路径,URL或原始向量直接读取图像image_read。该image_info函数显示了一些关于图像的元型态数据,类似于ImageMagick的 identify命令行实用程序。
library(magick)
tiger <- image_read_svg('http://jeroen.github.io/images/tiger.svg', width = 400)
print(tiger)
## format width height colorspace matte filesize density
## 1 PNG 400 400 sRGB TRUE 0 72x72
使用我们image_write以任何格式将图像导出到磁盘上的文件或内存中path = NULL。
# Render svg to png bitmap
image_write(tiger, path = "tiger.png", format = "png")如果path的英文文件名,则image_write报道查看path成功,以便可以将结果传送到采用文件路径的函数。
转换格式
Magick以原始格式将图像保存在内存中。要指定为转换格式其他的format参数image_write。在应用转换之前,您还可以在内部将图像转换为其他格式。如果您的原始格式有损,这可能很有用。
tiger_png <- image_convert(tiger, "png")
image_info(tiger_png)
## format width height colorspace matte filesize density
## 1 PNG 400 400 sRGB TRUE 0 72x72请注意,大小目前为0,因为ImageMagick的是懒惰的(在很好的意义上)并且在必须之前不会渲染。
预习
具有内置的Web浏览器(例如RStudio)的IDE会自动在查看器中显示magick图像。

或者,在Linux的上,可以您使用image_display在X11窗口中预览图像。求最后image_browse在系统-的默认应用程序中打开给定类型的图像。
# X11 only
image_display(tiger)

# System dependent
image_browse(tiger)
另一种方法是将图像转换为光栅对象并将其绘制在R的图形显示上。然而,这非常慢,仅与其他绘图功能结合使用。见下面的#raster。
转换
了解可用转换的最佳方法是浏览?transformationsRStudio帮助页面中的示例。下面举几个例子来了解什么是可能的。
剪切和编辑
转换一些函数采用一个geometry参数,该参数需要表单的特殊语法,AxB+C+D。其中每个元素都是可选的一些例子:
image_crop(image, "100x150+50"):裁剪width:100px并从左侧height:150px开始+50pximage_scale(image, "200"):按比例调整宽度:200pximage_scale(image, "x200"):按比例调整高度:200pximage_fill(image, "blue", "+100+200"):洪水从蓝点开始填充x:100, y:200image_border(frink, "red", "20x10"):添加左侧+右侧20像素和顶部+底部10px的的边框
完整语法在Magick :: Geometry文档中指定。
# Example image
frink <- image_read("https://jeroen.github.io/images/frink.png")print(frink)## format width height colorspace matte filesize density
## 1 PNG 220 445 sRGB TRUE 73494 72x72
# Add 20px left/right and 10px top/bottom
image_border(image_background(frink, "hotpink"), "#000080", "20x10")
# Trim margins
image_trim(frink)
# Passport pica
image_crop(frink, "100x150+50")
# Resize
image_scale(frink, "300") # width: 300px
image_scale(frink, "x300") # height: 300px
# Rotate or mirror
image_rotate(frink, 45)
image_flip(frink)
image_flop(frink)
# Brightness, Saturation, Hue
image_modulate(frink, brightness = 80, saturation = 120, hue = 90)
# Paint the shirt orange
image_fill(frink, "orange", point = "+100+200", fuzz = 20)
随着image_fill我们可以淹没填补开始像素point。该fuzz参数允许填充与具有相似颜色的相邻像素交叉。它的值必须在0到256 ^ 2之间,指定颜色之间的最大几何距离被认为是相等的。在这里,我们给教授弗林克橙色衬衫世界杯。
过滤器和效果
ImageMagick的还有一堆值得检查的标准效果。
# Add randomness
image_blur(frink, 10, 5)
image_noise(frink)
# Silly filters
image_charcoal(frink)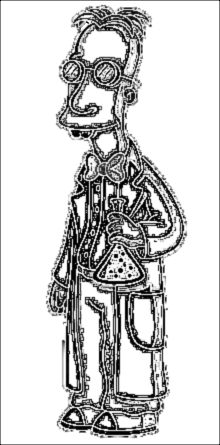
image_oilpaint(frink)
image_negate(frink)
内核卷积
该image_convolve()函数在图像上应用内核内核卷积意味着使用内核矩阵中定义的加权邻域来状语从句:重新计算每个像素值例如,让我们看看这个简单的内核。:
kern <- matrix(0, ncol = 3, nrow = 3)
kern[1, 2] <- 0.25
kern[2, c(1, 3)] <- 0.25
kern[3, 2] <- 0.25
kern
## [,1] [,2] [,3]
## [1,] 0.00 0.25 0.00
## [2,] 0.25 0.00 0.25
## [3,] 0.00 0.25 0.00此内核将每个像素更改为其水平和垂直相邻像素的平均值,这会在下面的右侧图像中产生轻微的模糊效果:
img <- image_resize(logo, "300x300")
img_blurred <- image_convolve(img, kern)
image_append(c(img, img_blurred))
使用或者任何标准内核
img %>% image_convolve('Sobel') %>% image_negate()
img %>% image_convolve('DoG:0,0,2') %>% image_negate()
文本注释
最后,在图像上打印一些文本会很有用:
# Add some text
image_annotate(frink, "I like R!", size = 70, gravity = "southwest", color = "green")
# Customize text
image_annotate(frink, "CONFIDENTIAL", size = 30, color = "red", boxcolor = "pink",
  degrees = 60, location = "+50+100")
# Fonts may require ImageMagick has fontconfig
image_annotate(frink, "The quick brown fox", font = 'Times', size = 30)
所支持的大多数平台上的字体包括"sans","mono","serif","Times","Helvetica","Trebuchet","Georgia","Palatino"或"Comic Sans"。
结合管道
图像每个函数变换原始报道查看图像的修改副本。它不会影响原始图像。
frink <- image_read("https://jeroen.github.io/images/frink.png")
frink2 <- image_scale(frink, "100")
image_info(frink)
## format width height colorspace matte filesize density
## 1 PNG 220 445 sRGB TRUE 73494 72x72image_info(frink2)## format width height colorspace matte filesize density
## 1 PNG 100 202 sRGB TRUE 0 72x72因此,要组合转换,您需要链接它们:
test <- image_rotate(frink, 90)
test <- image_background(test, "blue", flatten = TRUE)
test <- image_border(test, "red", "10x10")
test <- image_annotate(test, "This is how we combine transformations", color = "white", size = 30)
print(test)
## format width height colorspace matte filesize density
## 1 PNG 465 240 sRGB TRUE 0 72x72
使用magrittr管道语法使其更具可读性
image_read("https://jeroen.github.io/images/frink.png") %>%
  image_rotate(270) %>%
  image_background("blue", flatten = TRUE) %>%
  image_border("red", "10x10") %>%
  image_annotate("The same thing with pipes", color = "white", size = 30)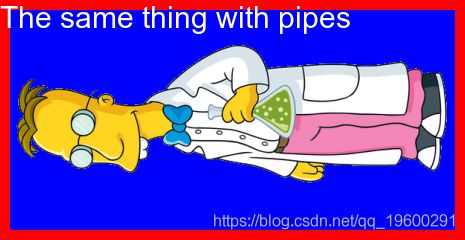
图像矢量
以上示例涉及单个图像。然而,magick中的所有函数都已经过矢量化,以支持使用图层,合成或动画。
标准的基本方法[ [[,c()并且length()用来操作其然后可以被视为层或帧中的图像的向量。
# Download earth gif and make it a bit smaller for vignette
earth <- image_read("https://jeroen.github.io/images/earth.gif") %>%
  image_scale("200x") %>%
  image_quantize(128)

length(earth)
## [1] 44earth
head(image_info(earth))## format width height colorspace matte filesize density
## 1 GIF 200 200 RGB FALSE 0 72x72
## 2 GIF 200 200 RGB FALSE 0 72x72
## 3 GIF 200 200 RGB FALSE 0 72x72
## 4 GIF 200 200 RGB FALSE 0 72x72
## 5 GIF 200 200 RGB FALSE 0 72x72
## 6 GIF 200 200 RGB FALSE 0 72x72rev(earth) %>%
image_flip() %>%
image_annotate("meanwhile in Australia", size = 20, color = "white")
图层
我们可以像在Photoshop中中一样将图层堆叠在一起:
bigdata <- image_read('https://jeroen.github.io/images/bigdata.jpg')
frink <- image_read("https://jeroen.github.io/images/frink.png")
logo <- image_read("https://jeroen.github.io/images/Rlogo.png")
img <- c(bigdata, logo, frink)
img <- image_scale(img, "300x300")
image_info(img)
## format width height colorspace matte filesize density
## 1 JPEG 300 225 sRGB FALSE 0 72x72
## 2 PNG 300 232 sRGB TRUE 0 72x72
## 3 PNG 148 300 sRGB TRUE 0 72x72马赛克将图像打印在彼此之上,扩展输出画布,使一切都适合:
image_mosaic(img)
展平将图层组合成单个图像,该图像具有第一个图像的大小:
image_flatten(img)
平和展镶嵌网求允许指定替代复合运算符:
image_flatten(img, 'Add')
image_flatten(img, 'Modulate')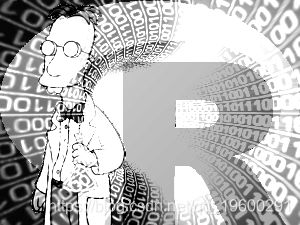
image_flatten(img, 'Minus')
结合
附加意味着简单地将框架彼此相邻:
image_append(image_scale(img, "x200"))
用于stack = TRUE将它们放在彼此的顶部:
image_append(image_scale(img, "100"), stack = TRUE)
编写允许在特定位置组合两个图像:
bigdatafrink <- image_scale(image_rotate(image_background(frink, "none"), 300), "x200")
image_composite(image_scale(bigdata, "x400"), bigdatafrink, offset = "+180+100")
网页
在阅读PDF文档时,每个页面都成为向量的元素。请注意,PDF会在读取时呈现,因此您需要立即指定密度。
manual <- image_read_pdf('https://cloud.r-project.org/web/packages/magick/magick.pdf', density = 72)
image_info(manual)
## format width height colorspace matte filesize density
## 1 PNG 612 792 sRGB TRUE 0 72x72
## 2 PNG 612 792 sRGB TRUE 0 72x72
## 3 PNG 612 792 sRGB TRUE 0 72x72
## 4 PNG 612 792 sRGB TRUE 0 72x72
## 5 PNG 612 792 sRGB TRUE 0 72x72
## 6 PNG 612 792 sRGB TRUE 0 72x72
## 7 PNG 612 792 sRGB TRUE 0 72x72
## 8 PNG 612 792 sRGB TRUE 0 72x72
## 9 PNG 612 792 sRGB TRUE 0 72x72
## 10 PNG 612 792 sRGB TRUE 0 72x72
## 11 PNG 612 792 sRGB TRUE 0 72x72
## 12 PNG 612 792 sRGB TRUE 0 72x72
## 13 PNG 612 792 sRGB TRUE 0 72x72
## 14 PNG 612 792 sRGB TRUE 0 72x72
## 15 PNG 612 792 sRGB TRUE 0 72x72
## 16 PNG 612 792 sRGB TRUE 0 72x72
## 17 PNG 612 792 sRGB TRUE 0 72x72
## 18 PNG 612 792 sRGB TRUE 0 72x72
## 19 PNG 612 792 sRGB TRUE 0 72x72
## 20 PNG 612 792 sRGB TRUE 0 72x72
## 21 PNG 612 792 sRGB TRUE 0 72x72
## 22 PNG 612 792 sRGB TRUE 0 72x72
## 23 PNG 612 792 sRGB TRUE 0 72x72
## 24 PNG 612 792 sRGB TRUE 0 72x72
## 25 PNG 612 792 sRGB TRUE 0 72x72
## 26 PNG 612 792 sRGB TRUE 0 72x72
## 27 PNG 612 792 sRGB TRUE 0 72x72
## 28 PNG 612 792 sRGB TRUE 0 72x72
## 29 PNG 612 792 sRGB TRUE 0 72x72manual[1]
动画
我们也可以在动画中制作帧,而不是将矢量元素视为图层。
image_animate(image_scale(img, "200x200"), fps = 1, dispose = "previous")
创建³³变形一系列n图像,逐渐将一个图像变换为另一个图像。它制作动画
newlogo <- image_scale(image_read("https://jeroen.github.io/images/Rlogo.png"), "x150")
oldlogo <- image_scale(image_read("https://developer.r-project.org/Logo/Rlogo-3.png"), "x150")
frames <- image_morph(c(oldlogo, newlogo), frames = 10)
image_animate(frames)
如果您读入现有的GIF或视频文件,则每个帧都会成为一个图层:
# Foreground image
banana <- image_read("https://jeroen.github.io/images/banana.gif")
banana <- image_scale(banana, "150")
image_info(banana)
## format width height colorspace matte filesize density
## 1 GIF 150 148 sRGB TRUE 0 72x72
## 2 GIF 150 148 sRGB TRUE 0 72x72
## 3 GIF 150 148 sRGB TRUE 0 72x72
## 4 GIF 150 148 sRGB TRUE 0 72x72
## 5 GIF 150 148 sRGB TRUE 0 72x72
## 6 GIF 150 148 sRGB TRUE 0 72x72
## 7 GIF 150 148 sRGB TRUE 0 72x72
## 8 GIF 150 148 sRGB TRUE 0 72x72操纵各个帧并将它们放回动画中:
# Background image
background <- image_background(image_scale(logo, "200"), "white", flatten = TRUE)

# Combine and flatten frames
frames <- image_composite(background, banana, offset = "+70+30")

# Turn frames into animation
animation <- image_animate(frames, fps = 10)
print(animation)
## format width height colorspace matte filesize density
## 1 gif 200 155 sRGB TRUE 0 72x72
## 2 gif 200 155 sRGB TRUE 0 72x72
## 3 gif 200 155 sRGB TRUE 0 72x72
## 4 gif 200 155 sRGB TRUE 0 72x72
## 5 gif 200 155 sRGB TRUE 0 72x72
## 6 gif 200 155 sRGB TRUE 0 72x72
## 7 gif 200 155 sRGB TRUE 0 72x72
## 8 gif 200 155 sRGB TRUE 0 72x72
动画可以保存为MPEG文件的GIF:
image_write(animation, "Rlogo-banana.gif")绘图和图形
该软件包的一个相对较新的补充是本机 - [R图形设备,它产生一个magick图像对象。这可以像常规设备一样用于制作绘图,或者可选地打开使用像素坐标绘制到现有图像上的设备。
图形设备
该image_graph()功能打开一个类似于png()或新的图形设备x11()。它返回将要写入绘图的图像对象。绘图设备中的每个“页面”将成为图像对象中的帧。
# Produce image using graphics device
fig <- image_graph(width = 400, height = 400, res = 96)
ggplot2::qplot(mpg, wt, data = mtcars, colour = cyl)
dev.off()
我们可以使用常规图像操作轻松地对图形进行后处理。
# Combine
out <- image_composite(fig, frink, offset = "+70+30")
print(out)
## format width height colorspace matte filesize density
## 1 PNG 400 400 sRGB TRUE 0 72x72
绘图设备
使用图形设备的另一种方式是使用像素坐标在现有图像上绘制。
# Or paint over an existing image
img <- image_draw(frink)
rect(20, 20, 200, 100, border = "red", lty = "dashed", lwd = 5)
abline(h = 300, col = 'blue', lwd = '10', lty = "dotted")
text(30, 250, "Hoiven-Glaven", family = "monospace", cex = 4, srt = 90)
palette(rainbow(11, end = 0.9))
symbols(rep(200, 11), seq(0, 400, 40), circles = runif(11, 5, 35),
  bg = 1:11, inches = FALSE, add = TRUE)
dev.off()print(img)## format width height colorspace matte filesize density
## 1 PNG 220 445 sRGB TRUE 0 72x72
默认情况下,image_draw()将所有边距设置为0,并使用图形坐标匹配图像大小(以像素为单位)(宽度X高度),其中(0,0)是左上角。请注意,这意味着ÿ轴从顶部到底部增加,这与典型的图形坐标相反。你可以通过自定义覆盖所有这一切xlim,ylim或mar值image_draw。
动画图形
图形设备支持多个帧,可以轻松创建动画图形。下面的代码显示了如何使用magick图形设备从非常酷的gganimate包中实现该示例。
library(gapminder)
library(ggplot2)
img <- image_graph(600, 340, res = 96)
datalist <- split(gapminder, gapminder$year)
out <- lapply(datalist, function(data){
  p <- ggplot(data, aes(gdpPercap, lifeExp, size = pop, color = continent)) +
    scale_size("population", limits = range(gapminder$pop)) + geom_point() + ylim(20, 90) +
    scale_x_log10(limits = range(gapminder$gdpPercap)) + ggtitle(data$year) + theme_classic()
  print(p)
})
dev.off()
animation <- image_animate(img, fps = 2)
print(animation)
## format width height colorspace matte filesize density
## 1 gif 600 340 sRGB TRUE 0 72x72
## 2 gif 600 340 sRGB TRUE 0 72x72
## 3 gif 600 340 sRGB TRUE 0 72x72
## 4 gif 600 340 sRGB TRUE 0 72x72
## 5 gif 600 340 sRGB TRUE 0 72x72
## 6 gif 600 340 sRGB TRUE 0 72x72
## 7 gif 600 340 sRGB TRUE 0 72x72
## 8 gif 600 340 sRGB TRUE 0 72x72
## 9 gif 600 340 sRGB TRUE 0 72x72
## 10 gif 600 340 sRGB TRUE 0 72x72
## 11 gif 600 340 sRGB TRUE 0 72x72
## 12 gif 600 340 sRGB TRUE 0 72x72
要将其写入文件,您只需执行以下操作:
image_write(animation, "gapminder.gif")光栅图像
Magick图像也可以转换为光栅对象,以便与[R的图形设备一起使用。因此我们可以将它与其他图形工具结合起来。但是要注意 - [R的图形设备非常慢并且具有非常不同的坐标系统,这降低了图像的质量。
Base R rasters
Base R具有as.raster将图像转换为字符串向量的格式。本文在R图形光栅图像由保罗·马雷尔给出了一个很好的概述。
plot(as.raster(frink))
# Print over another graphic
plot(cars)
rasterImage(frink, 21, 0, 25, 80)
该grid包
该grid软件包可以更轻松地在图形设备上叠加光栅,而无需调整图的x / y坐标。
library(ggplot2)
library(grid)
qplot(speed, dist, data = cars, geom = c("point", "smooth"))
## `geom_smooth()` using method = 'loess'grid.raster(frink)
该raster包
该raster。软件包有自己的位图类,空间对应用程序很有用将图像转换为栅格的最简单方法的英文将其导出为tiff文件:
tiff_file <- tempfile()
image_write(frink, path = tiff_file, format = 'tiff')
r <- raster::brick(tiff_file)
raster::plotRGB(r)
您也可以手动将位图数组转换为栅格对象,但这似乎会丢弃一些元数据:
buf <- as.integer(frink[[1]])
rr <- raster::brick(buf)
raster::plotRGB(rr, asp = 1)
光栅包似乎也不支持透明度,这在空间成像的背景下可能是有意义的。
OCR文本提取
。该软件包的最新成员是使用OCR从图像中提取文本这需要正方体包:
install.packages("tesseract")img <- image_read("http://jeroen.github.io/images/testocr.png")
print(img)## format width height colorspace matte filesize density
## 1 PNG 640 480 sRGB TRUE 23359 72x72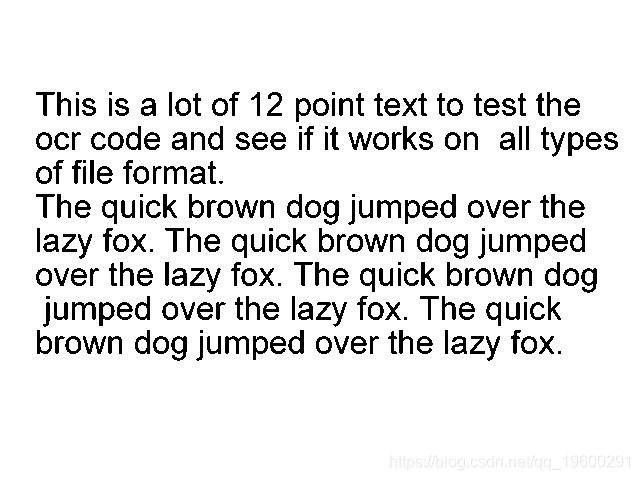
# Extract text
cat(image_ocr(img))