QCustomPlot 的使用-折线图和散点图
QCustomPlot 的使用
VS+QT+散点图
-
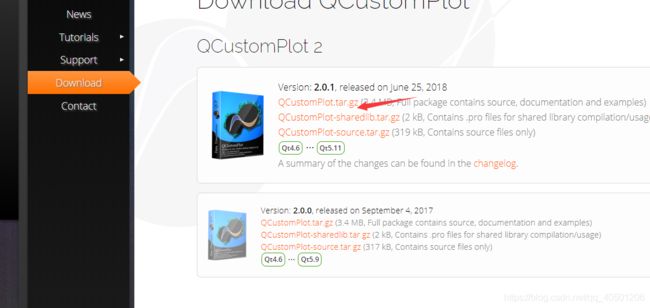
下载资源 https://www.qcustomplot.com/index.php/download
-
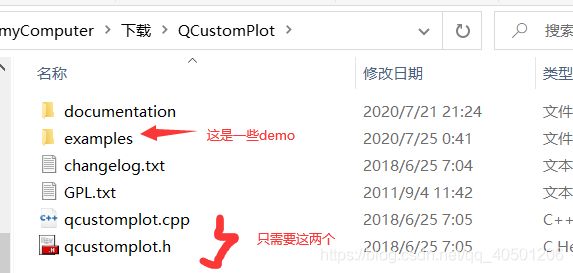
资源说明
-
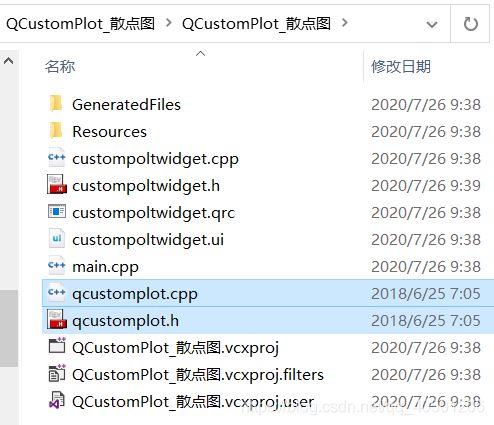
在VS中创建项目,同时将.cpp和.h放到对应的路径下
-
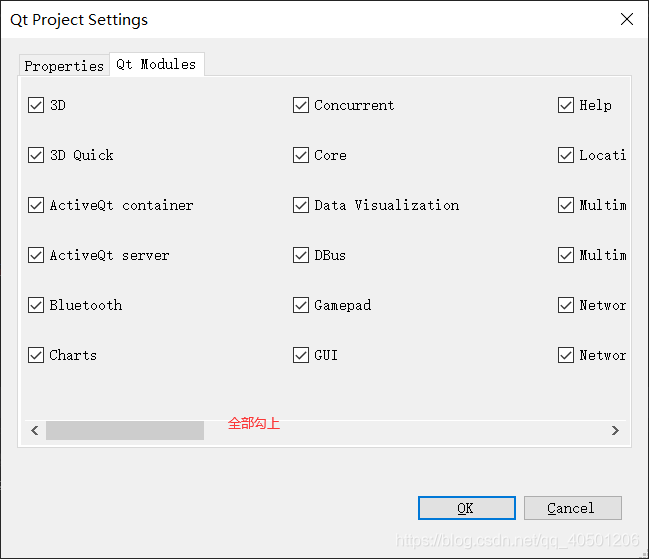
添加项目,引用
往项目中加入#include
ps 编译会出现一个问题Link2019
解决方案:
-
代码编写 两种鼠标显示数值
.h#pragma once #include#include "ui_custompoltwidget.h" #include "qcustomplot.h" class CustomPoltWidget : public QWidget { Q_OBJECT public: CustomPoltWidget(QWidget *parent = Q_NULLPTR); private: Ui::CustomPoltWidgetClass ui; QCustomPlot *customplot; QCPItemText *m_currentLabel;//显示坐标的文本框 QCPItemTracer *m_tracer;//锚点的一个标记 QVector m_VData;//存放数据 QVector m_DataSize;//存放数据的下标 private slots: //void SLOT_PlotData(char *, uint16_t); void SLOT_mouseTracetoCoord(QMouseEvent *event);//鼠标按下触发的槽函数,后面解释 }; .cpp
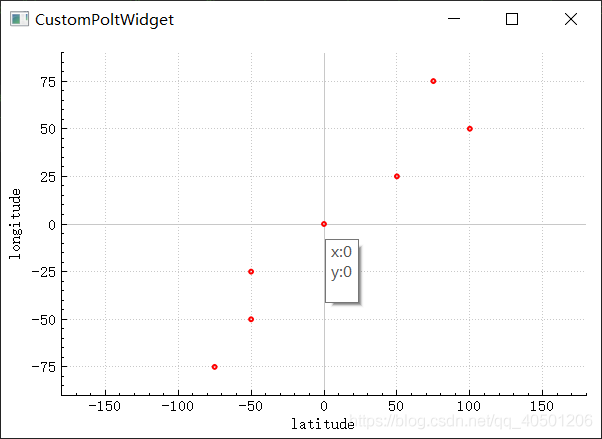
第一种鼠标显示值
有关函数:void CustomPoltWidget::SLOT_mouseTracetoCoord(QMouseEvent *event)#include "custompoltwidget.h" CustomPoltWidget::CustomPoltWidget(QWidget *parent) : QWidget(parent) { ui.setupUi(this); // 设置坐标范围、坐标名称 customplot = new QCustomPlot(this); customplot->resize(this->width(), this->height()); customplot->xAxis->setRange(-180.00, 180.00); customplot->yAxis->setRange(-90.00, 90.00); customplot->xAxis->setLabel("latitude"); customplot->yAxis->setLabel("longitude"); // 增加图层 customplot->addGraph(customplot->yAxis, customplot->xAxis); m_VData << -75 << -50 << -50 << 0 << 50 << 100 << 75; m_DataSize << -75 << -50 << -25 << 0 << 25 << 50 << 75; // 设置画笔风格 QPen drawPen; drawPen.setColor(Qt::red); drawPen.setWidth(4); // 绘制散点 QCPGraph * curGraph = customplot->addGraph(); curGraph->setPen(drawPen); curGraph->setLineStyle(QCPGraph::lsNone); curGraph->setScatterStyle(QCPScatterStyle(QCPScatterStyle::ssCircle, 2)); curGraph->setData(m_VData, m_DataSize); customplot->xAxis->setVisible(true); customplot->yAxis->setVisible(true); //设置绘制输出图像界面缩放 customplot->setInteractions(QCP::iRangeDrag | QCP::iRangeZoom); // // 保存为png图片 // QString path = QApplication::applicationDirPath() + "\\" + "test123.png"; // customplot->savePng(path); //小部件的属性配置 m_tracer = new QCPItemTracer(customplot);//设置部件的父类 m_tracer->setStyle(QCPItemTracer::tsCircle);//锚点的类型设置为圆形 m_tracer->setPen(QPen(Qt::red, 1, Qt::DashLine));//画笔类型 m_tracer->setBrush(Qt::NoBrush); m_currentLabel = new QCPItemText(customplot);//文本框父类设置 m_currentLabel->setLayer("overlay"); m_currentLabel->setClipToAxisRect(false); m_currentLabel->setPadding(QMargins(3, 3, 3, 3)); m_currentLabel->setPen(QPen(QColor(130, 130, 130), 0, Qt::DotLine)); m_currentLabel->setBrush(Qt::NoBrush); m_currentLabel->position->setParentAnchor(m_tracer->position);//显示位置跟随锚点的位置 m_currentLabel->setFont(QFont("Arial", 8)); m_currentLabel->setColor(Qt::red); m_tracer->position->setTypeX(QCPItemPosition::ptPlotCoords);//在曲线上显示 m_tracer->position->setTypeY(QCPItemPosition::ptPlotCoords); m_tracer->setSize(5); m_currentLabel->setPositionAlignment(Qt::AlignLeft | Qt::AlignVCenter); m_currentLabel->setVisible(false); m_tracer->setVisible(false); connect(customplot, SIGNAL(mousePress(QMouseEvent *)), this, SLOT(SLOT_mouseTracetoCoord(QMouseEvent *))); } void CustomPoltWidget::SLOT_mouseTracetoCoord(QMouseEvent *event) { //获取鼠标坐标点 QPointF ChickedPoint = event->pos(); m_currentLabel->setVisible(false); m_tracer->setVisible(false); //鼠标点击的后位置转换到下坐标轴对应坐标 int current_Rx = customplot->xAxis->pixelToCoord(ChickedPoint.x()); int current_Ry = customplot->yAxis->pixelToCoord(ChickedPoint.y()); QString m_position, s; m_position = "x:"; m_position += QString::number(current_Rx); m_position += "\n"; m_position += "y:"; m_position += QString::number(current_Ry); m_position += "\n"; QToolTip::showText(mapToGlobal(event->pos()), m_position, this); } // void CustomPoltWidget::SLOT_mouseTracetoCoord(QMouseEvent *event) // { // //获取鼠标坐标点 // QPointF ChickedPoint = event->pos(); // m_currentLabel->setVisible(false); // m_tracer->setVisible(false); // //排除区间外点 // if (customplot->viewport().contains(event->pos())) // { // //鼠标点击的后位置转换到下坐标轴对应坐标 // int16_t current_Rx = customplot->xAxis->pixelToCoord(ChickedPoint.x()); // int16_t current_Ry = customplot->yAxis->pixelToCoord(ChickedPoint.y()); // // //获取实部y轴的显示范围 // double y_range = (customplot->yAxis->range().size()) / 100; // double x_range = (customplot->xAxis->range().size()) / 50; // // if (!m_VData.empty()) // { // for (int i = 0; i != m_VData.size(); i++)//对我的数据集进行遍历 // { // if ((abs(current_Ry - m_VData.at(i)) <= y_range) && (abs(current_Rx - m_DataSize.at(i)) <= x_range)) // { // //QToolTip输出值 // #if 0 //value值观察实现的简易版本 鼠标箭头容易遮挡住label // QToolTip::showText(mapToGlobal(event->pos()), QString("%1 ,%2 ").arg(current_x).arg(current_y), this/*,QRectF(QPointF(15,15),QPointF(15,15))*/); // #else // m_currentLabel->setVisible(true); // m_tracer->setVisible(true); // m_tracer->position->setCoords(m_DataSize.at(i), m_VData.at(i)); // m_currentLabel->position->setCoords(0, -10);//对标签绘图位置进行向上偏移 // m_currentLabel->setText(QString("%1 ,%2 ").arg(current_Rx).arg(current_Ry)); // // break; // #endif // } // // } // customplot->replot(); // } // } // // else return; // // }效果图
第二种鼠标显示值
有关函数:void CustomPoltWidget::SLOT_mouseTracetoCoord(QMouseEvent *event)
将上边注释的解开
效果图
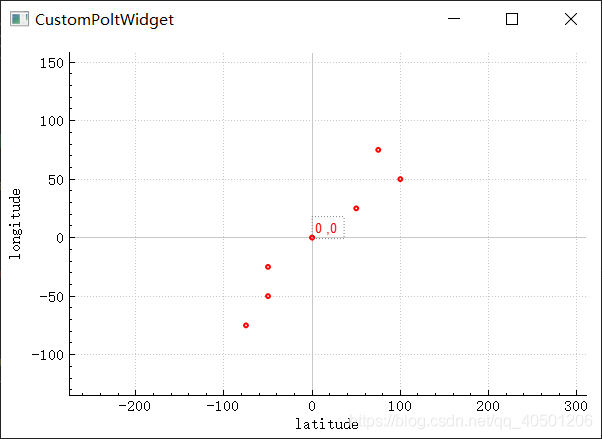
缺点,不够灵敏,需要等待一下时间。 -
代码补充和讲解
- customplot->xAxis->setTickLabels(false); 设置x轴坐标值不可见
- customplot->rescaleAxes();或者customplot->graph(0)->rescaleAxes();//自动设置显示界面的范围
- customplot->xAxis->setLabel(“latitude”);
customplot->yAxis->setLabel(“longitude”);//设置x,y轴的名字 - customplot->xAxis->setRange(-180.00, 180.00);
customplot->yAxis->setRange(-90.00, 90.00);//设置x,y轴的范围 - //设置绘制输出图像界面缩放
customplot->setInteractions(QCP::iRangeDrag | QCP::iRangeZoom); 参数可以从结构体里面找
- QString::number(current_Rx); //将数字转化为QString
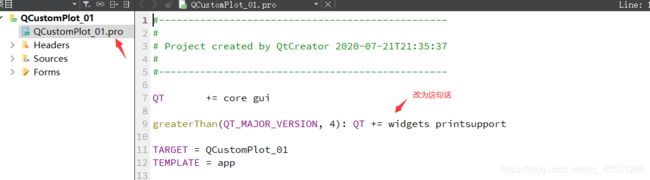
QtCreator+折线图
-
greaterThan(QT_MAJOR_VERSION, 4): QT += widgets printsupport
-
添加资源 右键-》现有文件-》选择对应的文件
-
设计ui
- 选择一个widget,改名为plot
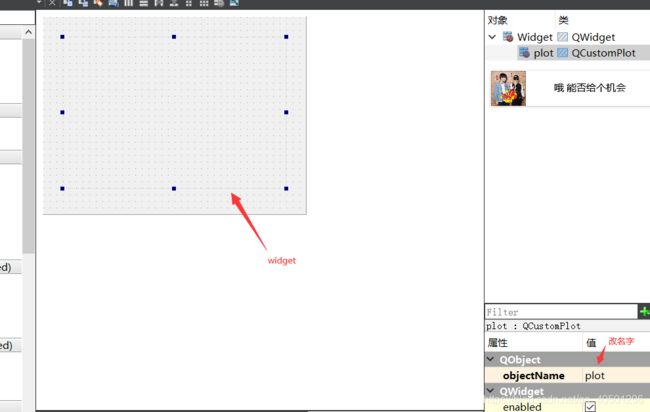
- 右键,提升为……
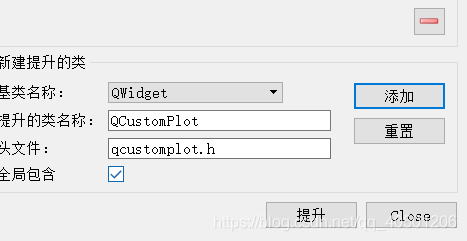
- 设置完之后,再点击widget 右键,提升为QCustomPlot
- 选择一个widget,改名为plot
-
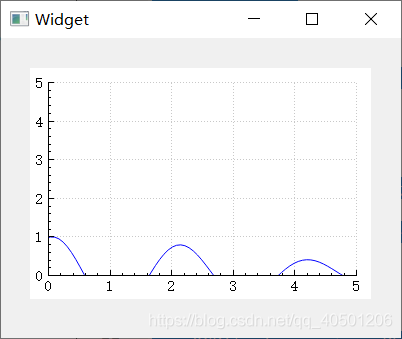
代码的编写1
.cpp #include "widget.h" #include "ui_widget.h" Widget::Widget(QWidget *parent) : QWidget(parent), x(100), y(100), ui(new Ui::Widget) { ui->setupUi(this); m_myName="我的折线图"; for(int i=0;i<100;i++){ x[i]=i; y[i]=1; } pos=0; m_timer=startTimer(0); ui->plot->addGraph(); ui->plot->graph()->setData(x,y); ui->plot->setInteractions(QCP::iRangeDrag|QCP::iRangeZoom); } Widget::~Widget() { delete ui; } void Widget::timerEvent(QTimerEvent* event){ double secs = QCPAxisTickerDateTime::dateTimeToKey(QDateTime::currentDateTime()); int n = 500; double phase = secs*5; double k = 3; QVectorx(n), y(n); for (int i=0; i .h #ifndef WIDGET_H #define WIDGET_H #include#include "qcustomplot.h" namespace Ui { class Widget; } class Widget : public QWidget { Q_OBJECT public: explicit Widget(QWidget *parent = 0); ~Widget(); void timerEvent(QTimerEvent* event); private: Ui::Widget *ui; QCPItemTracer *m_myPhaseTracer; QString m_myName; QVector x,y; int pos; int m_timer; }; #endif // WIDGET_H 效果图
-
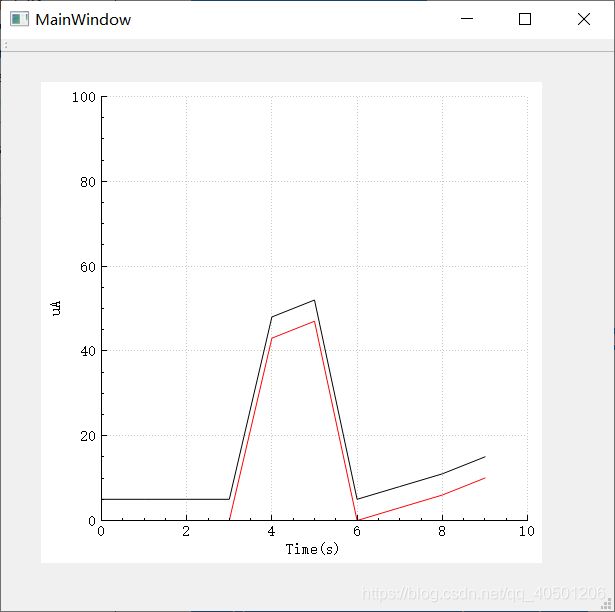
代码编写2
.h #ifndef MAINWINDOW_H #define MAINWINDOW_H #include "qcustomplot.h" #include#include namespace Ui { class MainWindow; } class MainWindow : public QMainWindow { Q_OBJECT public: explicit MainWindow(QWidget *parent = 0); ~MainWindow(); void Show_Plot(QCustomPlot *customPlot); private slots: void Time_Update(void); private: Ui::MainWindow *ui; QCustomPlot *customPlot; double num[10]; // 缓冲区 int cnt; }; #endif // MAINWINDOW_H .cpp #include "mainwindow.h" #include "ui_mainwindow.h" #include#include /* *了解x坐标轴的方法,添加数据的方式 * */ MainWindow::MainWindow(QWidget *parent) : QMainWindow(parent), ui(new Ui::MainWindow) { ui->setupUi(this); QTimer *timer = new QTimer(this); timer->start(1000); connect(timer,SIGNAL(timeout()),this,SLOT(Time_Update())); } MainWindow::~MainWindow() { delete ui; } void MainWindow::Time_Update(void) { QTime t; t=QTime::currentTime(); //生成随机数主要用到了函数qsrand和qrand qsrand(QTime(0, 0, 0).secsTo(QTime::currentTime())); cnt=qrand()%50; Show_Plot(ui->widget); } void MainWindow::Show_Plot(QCustomPlot *customPlot) { QVector key(10); QVector value(10); QVector value2(10); for(int i=0; i<9; i++) { num[i] = num[i+1]; } num[9] = cnt; for(int i=0;i<10;i++) { key[i] = i; value[i] = num[i]; value2[i] = num[i]+5; } customPlot->addGraph(); customPlot->graph(0)->setPen(QPen(Qt::red)); customPlot->graph(0)->setData(key,value); customPlot->addGraph(); customPlot->graph(1)->setPen(QPen(Qt::black)); customPlot->graph(1)->setData(key,value2); customPlot->xAxis->setLabel("Time(s)"); customPlot->yAxis->setLabel("uA"); customPlot->xAxis->setRange(0,10); customPlot->yAxis->setRange(0,100); customPlot->replot(); } 效果图
ps 说明这两个折线图是我参考别人的代码,主要是练手,熟悉一下这个第三方类,如果有问题,私信我!!