第5章 LinearR/PLR/SVR/KNN/DTR/RFR(测算房价)
测算房价
python数据挖掘预测Boston房价
1. 读取数据集:
数据集来自UCI机器学习知识库。波士顿房屋这些数据于1978年开始统计,共506个数据点,涵盖了麻省波士顿不同郊区房屋14种特征的信息。
Boston Housing | Kaggle
读取数据集(1):
发现从 kaggle 下载的数据集已经被分成训练集和测试集,所以训练集只有333个。
import pandas as pd

data = pd.read_csv(r'D:\machinelearningDatasets\BostonHousing\train.csv')
data.head()
data.info()
读取数据集(2):
利用scikit-learn的波士顿房价数据集。模拟 pandas 读取 csv 文件,创建 dataframe 类型数据集。
import matplotlib.pyplot as plt
import numpy as np
import pandas as pd
from sklearn.datasets import load_boston

boston = load_boston()
X = boston.data
y = boston.target

data = pd.DataFrame(X, columns=['crim', 'zn', 'indus', 'chas', 'nox', 'rm', 'age', 'dis', 'rad', 'tax','ptratio', 'black', 'lstat'])
data['medv']=y
data.head()
data.info()
检查数据中有没有空值:
data.isnull().any().sum()
反馈是0,说明该数据不需要对其进行空值处理,可以放心的进行后续工作了。
plt.matshow(data.corr())

相关矩阵用 matshow 绘制出来,颜色越深(黑),相关系数越小,颜色越浅(白),相关系数越大。相关系数可以为负数。
2. 提取特征:
DataFrame提取数据建议使用loc()和iloc()函数:
此法不妥:
x = data[[‘crim’, ‘zn’, ‘indus’, ‘chas’, ‘nox’, ‘rm’, ‘age’, ‘dis’, ‘rad’, ‘tax’, ‘ptratio’, ‘black’, ‘lstat’]]
y = data[[‘medv’]]
特征维度较大,为了保证模型的高效预测,需要进行特征选择。每种特征都有自己含义和数据量级,单纯地依靠方差来判断可能效果不好,直接使用与目标变量的相关性强的变量作为最终的特征变量。
x = data.loc[:,('crim', 'zn', 'indus', 'chas', 'nox', 'rm', 'age', 'dis', 'rad', 'tax', 'ptratio', 'black', 'lstat')]
y = data.loc[:,['medv']]
y.head()
训练时 y 的格式出现问题,只需将 y 改成 y.values.ravel() 即可
C:\Python36\lib\site-packages\sklearn\utils\validation.py:578: DataConversionWarning: A column-vector y was passed when a 1d array was expected. Please change the shape of y to (n_samples, ), for example using ravel().
y = column_or_1d(y, warn=True)
y = y.values.ravel()

#y.head()
#AttributeError: 'numpy.ndarray' object has no attribute 'head'
sklearn.feature_selection.SelectKBest
f_regression:
F-value between label/feature for regression tasks.
chi2
Chi-squared stats of non-negative features for classification tasks.
from sklearn.feature_selection import SelectKBest
from sklearn.feature_selection import f_regression

SelectKBest = SelectKBest(f_regression, k=5).fit(x,y)
SelectKBest.get_support()
array([False, False, True, False, False, True, False, False, False,
True, True, False, True])
x.columns[SelectKBest.get_support()]
Index([‘indus’, ‘rm’, ‘tax’, ‘ptratio’, ‘lstat’], dtype=‘object’)
我们看出和波士顿房价相关性最强的三个因素,分别是,rm(每栋住宅的房间数),ptratio(城镇中的教师学生比例),lstat(地区中有多少房东属于低收入人群),Indus(城镇中非住宅用地所占比例),tax(每一万美元的不动产税率)
from sklearn.preprocessing import MinMaxScaler
scaler = MinMaxScaler()

features = data.loc[:,('indus', 'rm', 'tax', 'ptratio', 'lstat')]
for feature in features.columns:
    features['Normalized_'+feature] = scaler.fit_transform(features[[feature]])

features.head()
features[['Normalized_rm', 'Normalized_ptratio', 'Normalized_lstat', 'Normalized_indus', 'Normalized_tax']].head()
3. 模型选择与优化
将数据拆分为训练数据及测试数据,采用交叉验证的方法对模型进行评估。
from sklearn.model_selection import train_test_split
x_train, x_test, y_train, y_test = train_test_split(features[['Normalized_rm', 'Normalized_ptratio', 'Normalized_lstat', 'Normalized_indus', 'Normalized_tax']], y, test_size=0.3,random_state=33)
from sklearn.model_selection import cross_val_predict
from sklearn.model_selection import cross_val_score
线性回归
from sklearn.linear_model import LinearRegression
lr = LinearRegression()
lr_predict = cross_val_predict(lr,x_train, y_train, cv=5)
lr_score = cross_val_score(lr, x_train, y_train, cv=5)
lr_meanscore = lr_score.mean()
多项式回归
在scikit-learn里,线性回归是由类 sklearn.linear_model.LinearRegression实现,多项式由类sklearn.preprocessing.PolynomialFeatures实现,可通过sklearn.pipeline.Pipeline把两个模型串起来。
管道机制实现了对全部步骤的流式化封装和管理(streaming workflows with pipelines)。Pipeline可以将许多算法模型串联起来,比如将特征提取、归一化、分类组织在一起形成一个典型的机器学习问题工作流。主要带来两点好处:
1.直接调用fit和predict方法来对pipeline中的所有算法模型进行训练和预测。
2.可以结合grid search对参数进行选择。
注意:管道机制更像是编程技巧的创新,而非算法的创新。
from sklearn.linear_model import LinearRegression
from sklearn.preprocessing import PolynomialFeatures
from sklearn.pipeline import Pipeline

def polynomial_model(degree=1):
    polynomial_features = PolynomialFeatures(degree=degree,
                                             include_bias=False)
    linear_regression = LinearRegression(normalize=True)
    pipeline = Pipeline([("polynomial_features", polynomial_features),
                         ("linear_regression", linear_regression)])
    return pipeline

poly_linear= polynomial_model(degree=2)
poly_linear_predict = cross_val_predict(poly_linear, x_train, y_train, cv=5)
poly_linear_score = cross_val_score(poly_linear, x_train, y_train, cv=5)
poly_linear_meanscore = poly_linear_score.mean()
支持向量机回归
from sklearn.svm import SVR
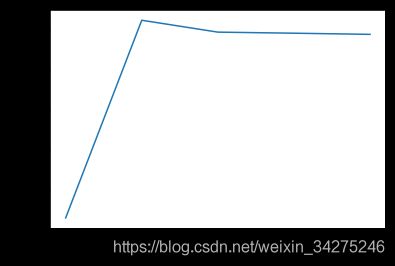
'linear’核我们通过更改惩罚系数C来查看对模型的影响
lSVR_score=[]
for i in [1,10,1e2,1e3,1e4]:
    linear_svr = SVR(kernel = 'linear', C=i)
    linear_svr_predict = cross_val_predict(linear_svr, x_train, y_train, cv=5)
    linear_svr_score = cross_val_score(linear_svr, x_train, y_train, cv=5)
    linear_svr_meanscore = linear_svr_score.mean()
    lSVR_score.append(linear_svr_meanscore)
plt.plot(lSVR_score)
plt.xlabel('log10(C)')
plt.ylabel('score')
linear_svr = SVR(kernel = 'linear', C=10)
linear_svr_predict = cross_val_predict(linear_svr, x_train, y_train, cv=5)
linear_svr_score = cross_val_score(linear_svr, x_train, y_train, cv=5)
linear_svr_meanscore = linear_svr_score.mean()
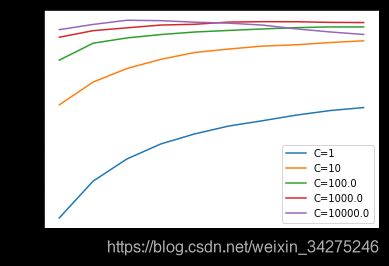
'poly’核优化,通过尝试修改惩罚系数C和degree
for i in [1,10,1e2,1e3,1e4]:
    polySVR_score=[]
    for j in np.linspace(1,10,10):
        poly_svr = SVR(kernel = 'poly', C=i, degree=j)
        poly_svr_predict = cross_val_predict(poly_svr, x_train, y_train, cv=5)
        poly_svr_score = cross_val_score(poly_svr, x_train, y_train, cv=5)
        poly_svr_meanscore = poly_svr_score.mean()
        polySVR_score.append(poly_svr_meanscore)
    plt.plot(np.linspace(1,10,10),polySVR_score,label='C='+str(i))
    plt.legend()
plt.xlabel('degree')
plt.ylabel('score')
poly_svr = SVR(kernel = 'poly', C=10000, degree=2)
poly_svr_predict = cross_val_predict(poly_svr, x_train, y_train, cv=5)
poly_svr_score = cross_val_score(poly_svr, x_train, y_train, cv=5)
poly_svr_meanscore = poly_svr_score.mean()
‘rbf’核优化,优化惩罚系数C和gamma
for i in [1,10,1e2,1e3,1e4]:
    rbfSVR_score=[]
    for j in np.linspace(0.1,1,10):
        rbf_svr = SVR(kernel = 'rbf', C=i, gamma=j)
        rbf_svr_predict = cross_val_predict(rbf_svr, x_train, y_train, cv=5)
        rbf_svr_score = cross_val_score(rbf_svr, x_train, y_train, cv=5)
        rbf_svr_meanscore = rbf_svr_score.mean()
        rbfSVR_score.append(rbf_svr_meanscore)
    plt.plot(np.linspace(0.1,1,10),rbfSVR_score,label='C='+str(i))
    plt.legend()
plt.xlabel('gamma')
plt.ylabel('score')
rbf_svr = SVR(kernel = 'rbf', C=1000, gamma=0.8)
rbf_svr_predict = cross_val_predict(rbf_svr, x_train, y_train, cv=5)
rbf_svr_score = cross_val_score(rbf_svr, x_train, y_train, cv=5)
rbf_svr_meanscore = rbf_svr_score.mean()
K近邻回归
在KNN的回归模型当中,我们没法确定n_neighbors,因此需要最优化这个参数。
from sklearn.neighbors import KNeighborsRegressor
score=[]
for n_neighbors in range(1,21):
    knn = KNeighborsRegressor(n_neighbors, weights = 'uniform' )
    knn_predict = cross_val_predict(knn, x_train, y_train, cv=5)
    knn_score = cross_val_score(knn, x_train, y_train, cv=5)
    knn_meanscore = knn_score.mean()
    score.append(knn_meanscore)
plt.plot(score)
plt.xlabel('n-neighbors')
plt.ylabel('mean-score')
n_neighbors=3
knn = KNeighborsRegressor(n_neighbors, weights = 'uniform' )
knn_predict = cross_val_predict(knn, x_train, y_train, cv=5)
knn_score = cross_val_score(knn, x_train, y_train, cv=5)
knn_meanscore = knn_score.mean()
决策树回归
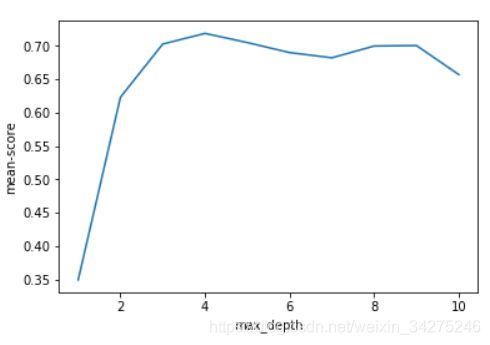
和KNN类似,没法确定决策树的深度,因此令最大深度分别是1至10。
#Decision Tree
from sklearn.tree import DecisionTreeRegressor
score=[]
for n in range(1,11):
    dtr = DecisionTreeRegressor(max_depth = n)
    dtr_predict = cross_val_predict(dtr, x_train, y_train, cv=5)
    dtr_score = cross_val_score(dtr, x_train, y_train, cv=5)
    dtr_meanscore = dtr_score.mean()
    score.append(dtr_meanscore)
plt.plot(np.linspace(1,10,10), score)
plt.xlabel('max_depth')
plt.ylabel('mean-score')
n=4
dtr = DecisionTreeRegressor(max_depth = n)
dtr_predict = cross_val_predict(dtr, x_train, y_train, cv=5)
dtr_score = cross_val_score(dtr, x_train, y_train, cv=5)
dtr_meanscore = dtr_score.mean()
随机森林回归
#RandomForest
from sklearn.ensemble import RandomForestRegressor

rfr = RandomForestRegressor(n_estimators=100)
rfr_predict = cross_val_predict(rfr, x_train, y_train, cv=5)
rfr_score = cross_val_score(rfr, x_train, y_train, cv=5)
rfr_meanscore = rfr_score.mean()
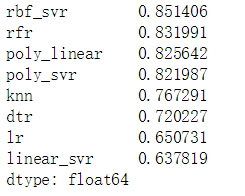
4. 模型评估
evaluating = {
        'rfr':rfr_score,
        'poly_linear':poly_linear_score,
        'lr':lr_score,
        'linear_svr':linear_svr_score,
        'poly_svr':poly_svr_score,
        'rbf_svr':rbf_svr_score,
        'knn':knn_score,
        'dtr':dtr_score
        }
evaluating = pd.DataFrame(evaluating)
evaluating.head()
evaluating.plot.kde(alpha=0.6,figsize=(12,7))
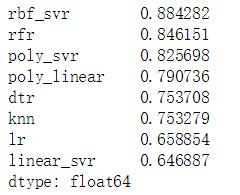
evaluating.mean().sort_values(ascending=False)
预测测试集(x_test, y_test)
#poly_linear
poly_linear.fit(x_train,y_train)
poly_linear_y_predict = poly_linear.predict(x_test)
poly_linear_y_predict_score = poly_linear.score(x_test, y_test)

#rbf
rbf_svr.fit(x_train,y_train)
rbf_svr_y_predict = rbf_svr.predict(x_test)
rbf_svr_y_predict_score=rbf_svr.score(x_test, y_test)

#KNN
knn.fit(x_train,y_train)
knn_y_predict = knn.predict(x_test)
knn_y_predict_score = knn.score(x_test, y_test)

#poly_svr
poly_svr.fit(x_train,y_train)
poly_svr_y_predict = poly_svr.predict(x_test)
poly_svr_y_predict_score = poly_svr.score(x_test, y_test)

#dtr
dtr.fit(x_train, y_train)
dtr_y_predict = dtr.predict(x_test)
dtr_y_predict_score = dtr.score(x_test, y_test)

#lr
lr.fit(x_train, y_train)
lr_y_predict = lr.predict(x_test)
lr_y_predict_score = lr.score(x_test, y_test)

#linear_svr
linear_svr.fit(x_train, y_train)
linear_svr_y_predict = linear_svr.predict(x_test)
linear_svr_y_predict_score = linear_svr.score(x_test, y_test)

predict_score = {
        'poly_linear':poly_linear_y_predict_score,
        'lr':lr_y_predict_score,
        'linear_svr':linear_svr_y_predict_score,
        'poly_svr':poly_svr_y_predict_score,
        'rbf_svr':rbf_svr_y_predict_score,
        'knn':knn_y_predict_score,
        'dtr':dtr_y_predict_score
        }
predict_score = pd.DataFrame(predict_score, index=['score']).transpose()
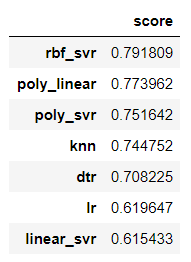
predict_score.sort_values(by='score',ascending = False)
SelectKBest = SelectKBest(f_regression, k=10).fit(x,y)
x.columns[SelectKBest.get_support()]
Index([‘crim’, ‘zn’, ‘indus’, ‘nox’, ‘rm’, ‘age’, ‘rad’, ‘tax’, ‘ptratio’, ‘lstat’], dtype=‘object’)
optimizer.mean().sort_values(ascending=False)
测试测试集:
......
predict_score = pd.DataFrame(predict_score, index=['score']).transpose()
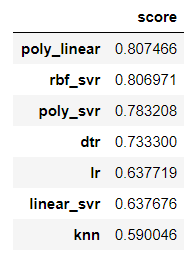
predict_score.sort_values(by='score',ascending = False)
参考:
Matshow
import matplotlib.pyplot as plt
import numpy as np

def samplemat(dims):
    """Make a matrix with all zeros and increasing elements on the diagonal"""
    aa = np.zeros(dims)
    for i in range(min(dims)):
        aa[i, i] = i
        aa[14-i,i] = -i
    return aa

# Display matrix
plt.matshow(samplemat((15, 15)))


