ggplot扩展包--gghalves
gghalves包
描述
这里主要介绍这个包中的geom_half_violin()函数,它相当于geom_violin()函数的变体,因为这个函数主要作用就是展示一半的小提琴图,然后与其他图形组合。
使用
geom_half_violin(mapping = NULL, data = NULL, stat = "half_ydensity",
  position = "dodge", ..., side = "l", nudge = 0,
  draw_quantiles = NULL, trim = TRUE, scale = "area",
  na.rm = FALSE, show.legend = NA, inherit.aes = TRUE)

stat_half_ydensity(mapping = NULL, data = NULL, geom = "half_violin",
  position = "dodge", ..., bw = "nrd0", adjust = 1,
  kernel = "gaussian", trim = TRUE, scale = "area", na.rm = FALSE,
  show.legend = NA, inherit.aes = TRUE)
参数
| 参数 | 解释 |
|---|---|
mapping |
通过aes()指定图形属性映射。默认为NULL,使用ggplot()中aes()指定的映射。 |
data |
指定数据框。默认为NULL,使用ggplot()中的数据。 |
stat |
覆盖geom_density()和stat_density()之间的默认连接。 |
position |
位置调整,可以是字符串,默认为"dodge",也可以是位置调整函数的调用结果。 |
... |
其他参数,通常是图形属性,将其设置为固定值,如color = "red"或者size = 3。 |
side |
画半小提琴图的一侧。 “ l”代表左,“ r”代表右,默认为“ l”。 |
nudge |
在小提琴图和分配给x轴上给定因子的空间中间之间添加空间。 |
draw_quantiles |
如果不是MULL(默认为NULL),在给定的密度估计分位数处绘制水平线。 |
trim |
若为TRUE(默认),将小提琴的尾部修整到数据范围。 若为FALSE,不修剪尾巴。 |
scale |
如果为"area"(默认),则所有小提琴都具有相同的面积(修剪尾部之前)。如果为 "count",则面积将与观察值成比例地缩放。如果为"width",则所有小提琴都具有相同的最大宽度。 |
na.rm |
如果为FALSE(默认),则会使用警告删除缺失值。如果为TRUE,则会自动删除缺少的值。 |
show.legend |
逻辑值,默认为NA,若为FALSE,不显示该图层的图例;若为 TRUE,则显示该图层的图例。它也可以是带有名称(图形属性)的逻辑向量,用来选择要显示的图形属性。 如 show.legend = c(size = TRUE,color = FALSE)表示显示size对应的图例,而不显示 color对应的图例。 |
inherit.aes |
默认为TRUE,若为FALSE,覆盖ggplot()中aes()默认属性,而不是与他们组合。 |
geom |
覆盖geom_density()和stat_density()之间的默认连接。 |
bw |
要使用的平滑带宽度。如果是数字,则为平滑内核的标准差。 |
adjust |
多次带宽调整。这使得可以在仍使用带宽估计器的情况下调整带宽。 例如, adjust = 1/2表示使用默认带宽的一半。 |
kernel |
内核,平滑曲线方法。详见:density() |
示例
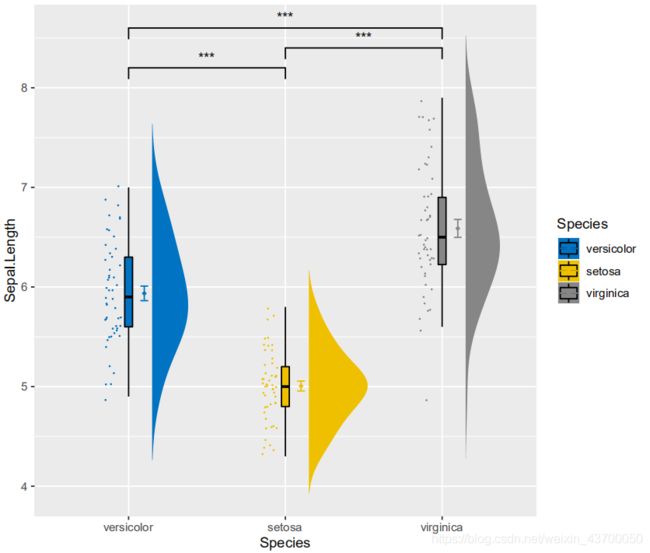
云雨图
library(tidyverse)
# 统计摘要
summ_iris <- iris %>%
  group_by(Species) %>%
  summarise(
    mean = mean(Sepal.Length),
    sd = sd(Sepal.Length),
    n = n()
  ) %>%
  mutate(se = sd/sqrt(n),
         Species = factor(Species, levels = c('versicolor', 'setosa', 'virginica')))

# 数据转换
iris_plot <- iris %>%
  mutate(Species = factor(Species, levels = c('versicolor', 'setosa', 'virginica')))

# 绘图
library(gghalves)
library(ggpubr)
library(ggsignif)
ggplot(iris_plot , aes(x = Species, y = Sepal.Length, fill = Species))+
  geom_half_violin(aes(fill = Species),
                   position = position_nudge(x = .15, y = 0),
                   adjust=1.5, trim=FALSE, colour=NA, side = 'r') +
  geom_point(aes(x = as.numeric(Species) - 0.1,
                 y = Sepal.Length,color = Species),
                 position = position_jitter(width = .05),size = .25, shape = 20) +
  geom_boxplot(aes(x = Species,y = Sepal.Length, fill = Species),
               outlier.shape = NA,
               width = .05,
               color = "black")+
  geom_point(data=summ_iris,
             aes(x=Species,y = mean,group = Species, color = Species),
             shape=18,
             size = 1.5,
             position = position_nudge(x = .1,y = 0)) +
  geom_errorbar(data = summ_iris,
                aes(x = Species, y = mean, group = Species, colour = Species,
                    ymin = mean-se, ymax = mean+se),
                width=.05,
                position=position_nudge(x = .1, y = 0)
                ) +
  scale_color_jco() +
  scale_fill_jco() +
  geom_signif(comparisons = list(c("versicolor", "setosa"),
                                 c("versicolor", "virginica"),
                                 c("setosa", "virginica")),
              y_position = c(8.2, 8.6, 8.4),
              map_signif_level = c("***" = 0.001, "**" = 0.01, "*" = 0.05)) +
  ggsave('云雨图.pdf', width = 7, height = 6)
