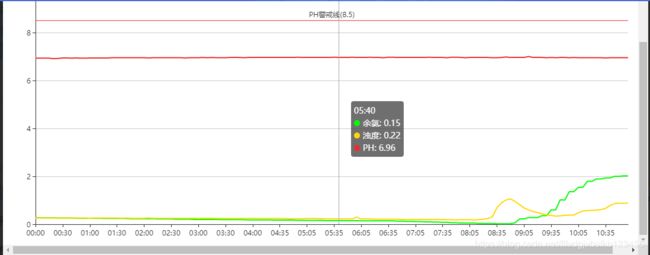
echarts折线图添加警戒线
第一种:
var option = {
    color: ['#00FF00', '#FFD700', '#EE2C2C'],
    tooltip: {
        trigger: 'axis'
    },
    legend: {
    },
    grid: {
        left: '3%',
        right: '4%',
        bottom: '3%',
        containLabel: true
    },
    xAxis: {
        type: 'category',
        boundaryGap: false,
        data: data.map(function (item) {
            return (item.createTime).substring(11,16);
        })
    },
    yAxis: {
        type: 'value',
        max: '10'  //设置y轴最大值
    },
    series: [
        {
            symbol: "none",
            name: '余氯',
            type: 'line',
            data: data.map(function(item){  //map()方法返回一个新数组
                return item.chlorineSize;
            })
        },
        {
            symbol: "none",
            name: '浊度',
            type: 'line',
            data: data.map(function(item){
                return item.turbiditySize;
            }),
        },
        {
            symbol: "none",
            name: 'PH',
            type: 'line',
            data: data.map(function (item) {
                return item.phSize;
            }),
            markLine : {
                symbol:"none",               //去掉警戒线最后面的箭头
                label:{
                    position:"middle",         //将警示值放在哪个位置,三个值“start”,"middle","end"  开始  中点 结束
                    formatter: "PH警戒线(8.5)"
                },
                data : [{
                    silent:false,             //鼠标悬停事件  true没有,false有
                    lineStyle:{               //警戒线的样式  ,虚实  颜色
                        type:"solid",
                        color:"rgba(238, 99, 99)"
                    },
                    yAxis: "8.5"     //警戒线在y轴的坐标
                }]
            }
        }
    ]
};
var myChart = echarts.init(document.getElementById('pieChart'));
myChart.setOption(option);
第二种:
function showPhCharts(data,condition){
        var phScope = "${organization.phScope}";  //ph范围 6.5-8.5
        var str = phScope.split("-");  //截取成数组
        var ph1 = parseFloat(str[0]);  //把字符串转成小数
        var ph2 = parseFloat(str[1]);
        var myChart = echarts.init(document.getElementById('waterPh'));
        var option = {
            title: {
                left: 'center',
                text: condition.startTime+'PH值变化情况'
            },
            tooltip: {
                trigger: 'axis'
            },
            xAxis: {
                data: data.map(function (item) {
                    return (item.createTime).substring(11,16);
                })
            },
            yAxis: {
                splitLine: {
                    show: false
                },
                max: '10'  //设置y轴最大值
            },
            toolbox: {
                left: 'center'
            },
            dataZoom: [{
                type: 'inside'
            }],
            visualMap: {
                top: 0,
                right: 0,
                pieces: [{
                    gt: 0,           //gt(大于,greater than)
                    lte: ph1,        //lte(小于等于 lettle than or equals)
                    color: 'red',
                    label:'小于'+ph1+'异常'
                },{
                    gt: ph1,
                    lte: ph2,
                    color: 'green',
                    label:'介于'+ph1+'~'+ph2+'正常'
                },{
                    gt: ph2,
                    color: 'red',
                    label:'大于'+ph2+'异常'
                }],
                outOfRange: {
                    color: '#999'
                }
            },
            series: {
                name: 'PH值',
                type: 'line',
                data: data.map(function(item){
                    return item.phSize;
                }),
                markLine: {
                    silent: true,
                    data: [{
                        yAxis: ph1
                    },
                        {
                            yAxis: ph2
                        }]
                }
            }
        }
        myChart.setOption(option);
  }
属性文档解释:https://www.w3cschool.cn/echarts_tutorial/echarts_tutorial-4hnc2d9j.html
官方案例:https://echarts.apache.org/examples/zh/editor.html?c=line-aqi

