GraphViz的dot绘图
1. Graphviz介绍
Graphviz是大名鼎鼎的贝尔实验室的几位牛人开发的一个画图工具。它的理念和一般的“所见即所得”的画图工具不一样,是“所想即所得”。
Graphviz提供了dot语言来编写绘图脚本。什么?!画个图也需要一个语言!!不要急,dot语言是非常简单地,只要看了下面几个列子,就能使用了。
2. Graphviz的几个例子
2.1 Fancy graph
digraph G{

	size = "4, 4";//图片大小
	main[shape=box];/*形状*/

	main->parse;
	parse->execute;

	main->init[style = dotted];//虚线

	main->cleanup;

	execute->{make_string; printf}//连接两个

	init->make_string;

	edge[color = red]; // 连接线的颜色

	main->printf[style=bold, label="100 times"];//线的 label

	make_string[label = "make a\nstring"]// \n, 这个node的label,注意和上一行的区别

	node[shape = box, style = filled, color = ".7.3 1.0"];//一个node的属性

	execute->compare;
}
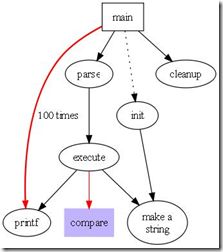
从上面的代码可以看出,dot语言非常简单,就是一个纯描述性的语言而已。
大家可以把上面的代码和下图中的连接对应起来看。
<图1. Fancy graph>
2.2 Polygon graph
digraph G{
	size = "4, 4"
	a->b->c;
	b->d;

	a[shape = polygon, sides = 5, peripheries=3, color = lightblue, style = filled];
	//我的形状是多边形,有五条边,3条边框, 颜色的淡蓝色, 样式为填充
	c[shape = polygon, sides = 4, skew= 0.4, lable = "hello world"];
	//我的形状是4变形, 角的弯曲度0.4, 里面的内容为"hello world"
	d[shape = invtriange];
	//我是三角形
	e[shape = polygon, side = 4, distortion = .7];
	//我是梯形啊
}
下面是对应的图片:
<图2. Polygon graph>
2.3 连接点的方向
我们可以用“n”,”ne”,”e”,””se”, “sw”,”w”,”nw”,
分别表示冲哪一个方向连接这个节点(图形)-“north, northeast……”
如:
digraph G{
	//b->c[tailport = se];
	b->c:se;
}
<图3. Se graph>
2.4 数据结构图
The graph file was generated automatically from a session with the LDBX graphical interface to the standard DBX debugger. Nodes are drawn with the 'record' shape. Labels of this shape are interpreted specially as nested horizontal and vertical box lists formatted as tables. In a record label, curly braces { } enclose lists, vertical bar | separates list items, and creates a port identifier for attaching edges. Edges are also labeled with 'id' attributes. Though not demonstrated in this particular file, these attributes allow referencing multiple (parallel) edges between the same node pair.
这个图是由会议LDBX图形界面,向标准DBX调试者自动生成的。节点由“record”的形状绘制。边由"id'属性标记。
数据结构图是我们很容易用到的一类图形,一个简单地数据结构图代码如下:
digraph g {
graph [
rankdir = "LR"
];
node [
fontsize = "16"
shape = "ellipse"
];
edge [
];
"node0" [
label = " 0x10ba8| "
shape = "record"
];
"node1" [
label = " 0xf7fc4380|  |  |-1"
shape = "record"
];
"node2" [
label = " 0xf7fc44b8| | |2"
shape = "record"
];
"node3" [
label = " 3.43322790286038071e-06|44.79998779296875|0"
shape = "record"
];
"node4" [
label = " 0xf7fc4380|  |  |2"
shape = "record"
];
"node5" [
label = " (nil)| | |-1"
shape = "record"
];
"node6" [
label = " 0xf7fc4380|  |  |1"
shape = "record"
];
"node7" [
label = " 0xf7fc4380|  |  |2"
shape = "record"
];
"node8" [
label = " (nil)| | |-1"
shape = "record"
];
"node9" [
label = " (nil)| | |-1"
shape = "record"
];
"node10" [
label = " (nil)|  |  |-1"
shape = "record"
];
"node11" [
label = " (nil)|  |  |-1"
shape = "record"
];
"node12" [
label = " 0xf7fc43e0| | |1"
shape = "record"
];
"node0":f0 -> "node1":f0 [
id = 0
];
"node0":f1 -> "node2":f0 [
id = 1
];
"node1":f0 -> "node3":f0 [
id = 2
];
"node1":f1 -> "node4":f0 [
id = 3
];
"node1":f2 -> "node5":f0 [
id = 4
];
"node4":f0 -> "node3":f0 [
id = 5
];
"node4":f1 -> "node6":f0 [
id = 6
];
"node4":f2 -> "node10":f0 [
id = 7
];
"node6":f0 -> "node3":f0 [
id = 8
];
"node6":f1 -> "node7":f0 [
id = 9
];
"node6":f2 -> "node9":f0 [
id = 10
];
"node7":f0 -> "node3":f0 [
id = 11
];
"node7":f1 -> "node1":f0 [
id = 12
];
"node7":f2 -> "node8":f0 [
id = 13
];
"node10":f1 -> "node11":f0 [
id = 14
];
"node10":f2 -> "node12":f0 [
id = 15
];
"node11":f2 -> "node1":f0 [
id = 16
];
}

<图4. Data graph>
2.5 Hash table graph
digraph g {
nodesep = .05;
rankdir = LR;
node[shape = record, width = .1, height = .1];
node0[label = " | | | | | | | ", height = 2.5];
//我是一个节点,我有7个属性
node [width = 1.5];
node1[label = "{ n14 | 719 |}
"];
//我还是一个节点, 也定义了三个属性
node2[label = "{ a1 | 719 |}
"];
node3[label = "{ i9 | 512 |}
"];
node4[label = "{ e5 | 632 |}
"];
node5[label = "{ t20 | 959 |}
"];
node6[label = "{ o15 | 794 |}
"];
node7[label = "{ s19 | 659 |}
"];
//好了,我开始连接了
node0:f0->node1:n;
node0:f1->node2:n;
node0:f2->node3:n;
node0:f5->node4:n;
node0:f6->node5:n;
node2:p->node6:n;
node4:p->node7:n;
}
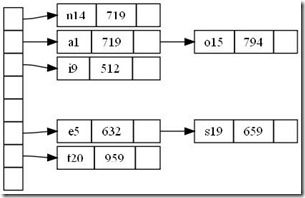
这是一个简单地哈希表,如下图所示
<图5. Hash table graph>
2.6 Cluster grahp
下面画一个轻量级的流程图。
digraph G {

	subgraph cluster_0 {
		style=filled;
		color=lightgrey;
		node [style=filled,color=white];
		a0 -> a1 -> a2 -> a3;
		label = "process #1";
	}

	subgraph cluster_1 {
		node [style=filled];
		b0 -> b1 -> b2 -> b3;
		label = "process #2";
		color=blue
	}
	start -> a0;
	start -> b0;
	a1 -> b3;
	b2 -> a3;
	a3 -> a0;
	a3 -> end;
	b3 -> end;

	start [shape=Mdiamond];
	end [shape=Msquare];
}
结果输出图形如下:
<图6. Hash table graph>
2.7 Crazy graph
显示Unix操作系统的层级。用随机值来测试多边形图形生成器和颜色映射管理器
digraph "unix" {
	graph [	fontname = "Helvetica-Oblique",
		fontsize = 36,
		label = "\n\n\n\nObject Oriented Graphs\nStephen North, 3/19/93",
		size = "6,6" ];
	node [	shape = polygon,
		sides = 4,
		distortion = "0.0",
		orientation = "0.0",
		skew = "0.0",
		color = white,
		style = filled,
		fontname = "Helvetica-Outline" ];
	"5th Edition" [sides=9, distortion="0.936354", orientation=28, skew="-0.126818", color=salmon2];
	"6th Edition" [sides=5, distortion="0.238792", orientation=11, skew="0.995935", color=deepskyblue];
	"PWB 1.0" [sides=8, distortion="0.019636", orientation=79, skew="-0.440424", color=goldenrod2];
	LSX [sides=9, distortion="-0.698271", orientation=22, skew="-0.195492", color=burlywood2];
	"1 BSD" [sides=7, distortion="0.265084", orientation=26, skew="0.403659", color=gold1];
	"Mini Unix" [distortion="0.039386", orientation=2, skew="-0.461120", color=greenyellow];
	Wollongong [sides=5, distortion="0.228564", orientation=63, skew="-0.062846", color=darkseagreen];
	Interdata [distortion="0.624013", orientation=56, skew="0.101396", color=dodgerblue1];
	"Unix/TS 3.0" [sides=8, distortion="0.731383", orientation=43, skew="-0.824612", color=thistle2];
	"PWB 2.0" [sides=6, distortion="0.592100", orientation=34, skew="-0.719269", color=darkolivegreen3];
	"7th Edition" [sides=10, distortion="0.298417", orientation=65, skew="0.310367", color=chocolate];
	"8th Edition" [distortion="-0.997093", orientation=50, skew="-0.061117", color=turquoise3];
	"32V" [sides=7, distortion="0.878516", orientation=19, skew="0.592905", color=steelblue3];
	V7M [sides=10, distortion="-0.960249", orientation=32, skew="0.460424", color=navy];
	"Ultrix-11" [sides=10, distortion="-0.633186", orientation=10, skew="0.333125", color=darkseagreen4];
	Xenix [sides=8, distortion="-0.337997", orientation=52, skew="-0.760726", color=coral];
	"UniPlus+" [sides=7, distortion="0.788483", orientation=39, skew="-0.526284", color=darkolivegreen3];
	"9th Edition" [sides=7, distortion="0.138690", orientation=55, skew="0.554049", color=coral3];
	"2 BSD" [sides=7, distortion="-0.010661", orientation=84, skew="0.179249", color=blanchedalmond];
	"2.8 BSD" [distortion="-0.239422", orientation=44, skew="0.053841", color=lightskyblue1];
	"2.9 BSD" [distortion="-0.843381", orientation=70, skew="-0.601395", color=aquamarine2];
	"3 BSD" [sides=10, distortion="0.251820", orientation=18, skew="-0.530618", color=lemonchiffon];
	"4 BSD" [sides=5, distortion="-0.772300", orientation=24, skew="-0.028475", color=darkorange1];
	"4.1 BSD" [distortion="-0.226170", orientation=38, skew="0.504053", color=lightyellow1];
	"4.2 BSD" [sides=10, distortion="-0.807349", orientation=50, skew="-0.908842", color=darkorchid4];
	"4.3 BSD" [sides=10, distortion="-0.030619", orientation=76, skew="0.985021", color=lemonchiffon2];
	"Ultrix-32" [distortion="-0.644209", orientation=21, skew="0.307836", color=goldenrod3];
	"PWB 1.2" [sides=7, distortion="0.640971", orientation=84, skew="-0.768455", color=cyan];
	"USG 1.0" [distortion="0.758942", orientation=42, skew="0.039886", color=blue];
	"CB Unix 1" [sides=9, distortion="-0.348692", orientation=42, skew="0.767058", color=firebrick];
	"USG 2.0" [distortion="0.748625", orientation=74, skew="-0.647656", color=chartreuse4];
	"CB Unix 2" [sides=10, distortion="0.851818", orientation=32, skew="-0.020120", color=greenyellow];
	"CB Unix 3" [sides=10, distortion="0.992237", orientation=29, skew="0.256102", color=bisque4];
	"Unix/TS++" [sides=6, distortion="0.545461", orientation=16, skew="0.313589", color=mistyrose2];
	"PDP-11 Sys V" [sides=9, distortion="-0.267769", orientation=40, skew="0.271226", color=cadetblue1];
	"USG 3.0" [distortion="-0.848455", orientation=44, skew="0.267152", color=bisque2];
	"Unix/TS 1.0" [distortion="0.305594", orientation=75, skew="0.070516", color=orangered];
	"TS 4.0" [sides=10, distortion="-0.641701", orientation=50, skew="-0.952502", color=crimson];
	"System V.0" [sides=9, distortion="0.021556", orientation=26, skew="-0.729938", color=darkorange1];
	"System V.2" [sides=6, distortion="0.985153", orientation=33, skew="-0.399752", color=darkolivegreen4];
	"System V.3" [sides=7, distortion="-0.687574", orientation=58, skew="-0.180116", color=lightsteelblue1];
	"5th Edition" -> "6th Edition";
	"5th Edition" -> "PWB 1.0";
	"6th Edition" -> LSX;
	"6th Edition" -> "1 BSD";
	"6th Edition" -> "Mini Unix";
	"6th Edition" -> Wollongong;
	"6th Edition" -> Interdata;
	Interdata -> "Unix/TS 3.0";
	Interdata -> "PWB 2.0";
	Interdata -> "7th Edition";
	"7th Edition" -> "8th Edition";
	"7th Edition" -> "32V";
	"7th Edition" -> V7M;
	"7th Edition" -> "Ultrix-11";
	"7th Edition" -> Xenix;
	"7th Edition" -> "UniPlus+";
	V7M -> "Ultrix-11";
	"8th Edition" -> "9th Edition";
	"1 BSD" -> "2 BSD";
	"2 BSD" -> "2.8 BSD";
	"2.8 BSD" -> "Ultrix-11";
	"2.8 BSD" -> "2.9 BSD";
	"32V" -> "3 BSD";
	"3 BSD" -> "4 BSD";
	"4 BSD" -> "4.1 BSD";
	"4.1 BSD" -> "4.2 BSD";
	"4.1 BSD" -> "2.8 BSD";
	"4.1 BSD" -> "8th Edition";
	"4.2 BSD" -> "4.3 BSD";
	"4.2 BSD" -> "Ultrix-32";
	"PWB 1.0" -> "PWB 1.2";
	"PWB 1.0" -> "USG 1.0";
	"PWB 1.2" -> "PWB 2.0";
	"USG 1.0" -> "CB Unix 1";
	"USG 1.0" -> "USG 2.0";
	"CB Unix 1" -> "CB Unix 2";
	"CB Unix 2" -> "CB Unix 3";
	"CB Unix 3" -> "Unix/TS++";
	"CB Unix 3" -> "PDP-11 Sys V";
	"USG 2.0" -> "USG 3.0";
	"USG 3.0" -> "Unix/TS 3.0";
	"PWB 2.0" -> "Unix/TS 3.0";
	"Unix/TS 1.0" -> "Unix/TS 3.0";
	"Unix/TS 3.0" -> "TS 4.0";
	"Unix/TS++" -> "TS 4.0";
	"CB Unix 3" -> "TS 4.0";
	"TS 4.0" -> "System V.0";
	"System V.0" -> "System V.2";
	"System V.2" -> "System V.3";
}
图 7 unix结构
2.8 辐射布局 TWOPI
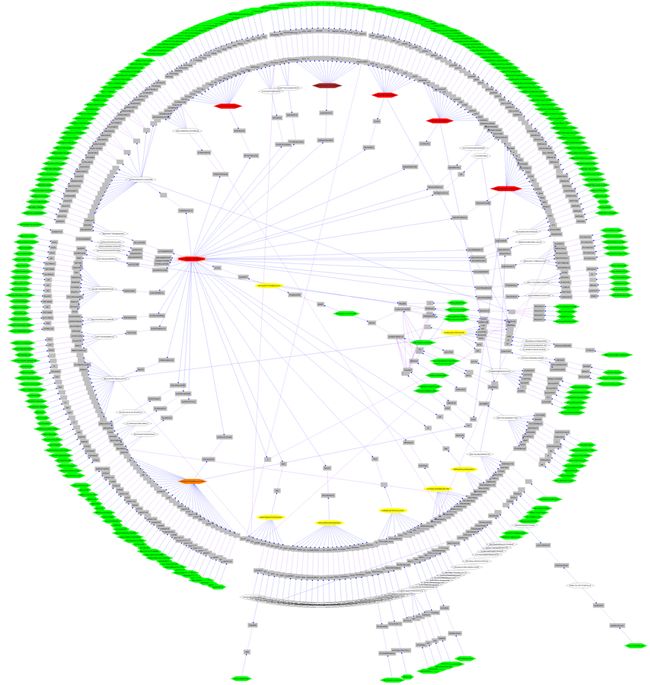
A real-world network containing 300 sites over 40 countries. The diagram was made to trace network incidents and to support maintenance. Original names and other details were obfuscated for anonymity. (This was not an AT&T network!) Drawn using twopi.
现实世界网络覆盖40个国家的含300个站点。这个图用来跟踪网络事件,并支持维护。
图 8 TWOPi(点击图片可以查看到gv文件)
3. 小结
相信这几个列子下来,对graphviz也有了了解了吧。而对于dot语言,作为一个描述性的语言就非常简单了, 只要有编程基础的人,模仿几个列子下来应该就能应用了。
详细信息可以查阅 http://www.graphviz.org/Gallery.php


