本文结构安排
- 经典聚类算法:线性聚类 Kmeans
- 经典聚类算法:非线性聚类 DBSCAN、谱聚类
- 新兴聚类算法:DenPeak,RCC
K-means
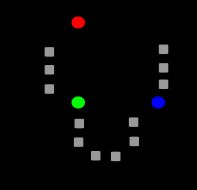
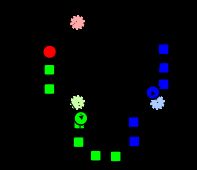
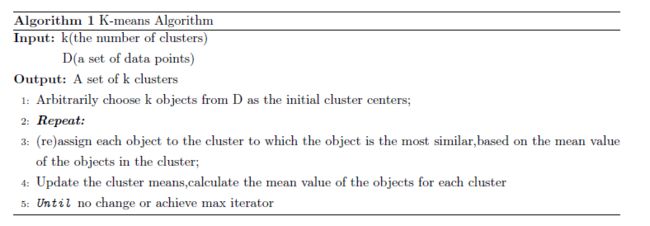
K-means clustering is a method of vector quantization, originally from signal processing, that is popular for cluster analysis in data mining. k-means clustering aims to partition n observations into k clusters in which each observation belongs to the cluster with the nearest mean, serving as a prototype of the cluster.
Given a set of observations ,where each observation is a d-dimensional real vector,k-means clustering aims to partition the n observations into set so as to minimize the within-cluster sum of variance,the objective is to find:
where is the mean of points in .
DBSCAN
Density-based spatial clustering of applications with noise (DBSCAN) is a data clustering algorithm.It
is a density-based clustering algorithm: given a set of points in some space, it groups together points that are closely packed together (points with many nearby neighbors), marking as outliers points that lie alone in low-density regions (whose nearest neighbors are too far away). DBSCAN is one of the most common clustering algorithms and also most cited in scientic literature.
Consider a set of points in some space to be clustered. For the purpose of DBSCAN clustering, the points are classied as core points,density-reachable points and outliers, as follows:
A point p is a core point if at least minPts points are within distance ( is the maximum radius of the neighborhood from p) of it (including p). Those points are said to be directly reachable from p.
A point q is directly reachable from p if point q is within distance from point p and p must be a core point.
A point q is reachable from p if there is a path with and , where each is
directly reachable from (all the points on the path must be core points, with the possible exception
of q).All points not reachable from any other point are outliers.
The DBSCAN algorithm can be abstracted into the following steps:
Find the (eps) neighbors of every point, and identify the core points with more than minPts neighbors.
Find the connected components of core points on the neighbor graph, ignoring all non-core points.
Assign each non-core point to a nearby cluster if the cluster is an (eps) neighbor, otherwise assign it to noise.
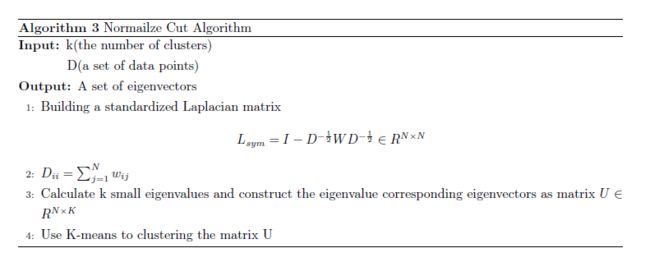
Normalize Cut
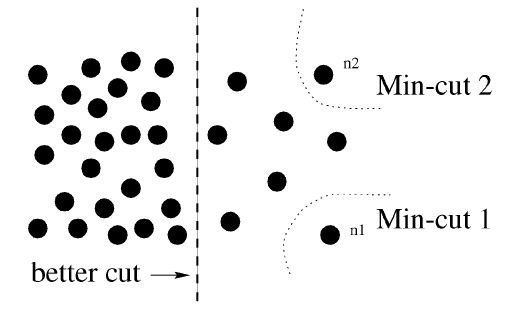
A graph can be partitioned into two disjoint sets, by simply removing edges connecting the two parts. In graph theoretic language, it is called the cut.
To avoid this unnatural bias for partitioning out small sets of points, we propose a new measure of disassociation between two groups. Instead of looking at the value of total edge weight connecting the two partitions, our measure computes the cut cost as a fraction of the total edge connections to all the nodes in the graph. We call this disassociation measure the normalized :
where , just show how well connected summed over all the nodes with A. In a segment,how well connected those nodes are.
Given a partition of nodes of a graph, V, into two sets A and B, let x be an dimensional indicator vector.
Putting everything together we have,
we can minimize Ncut by solving the generalized eigenvalue system,
RCC(Robust Continuous Clustering)
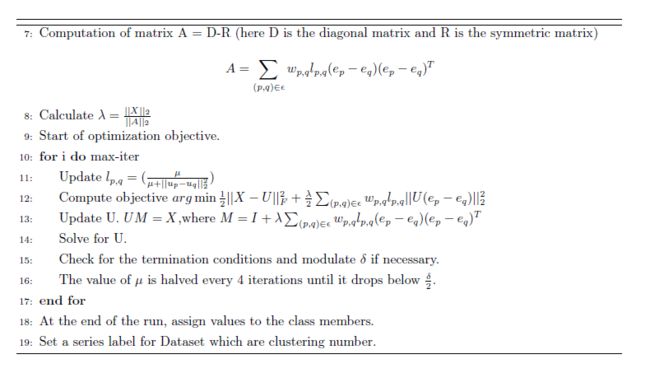
Give a dataset , and a similarity matrix , RCC algorithm objective is to learn a representation matrix ,
the objective function means that :The sample point and its representative point must be similar. The representative point needs to represent the characteristics of the original sample point. At the same time, the representative points of the adjacent samples should be similar, making the clustering feature more obvious.
objective:
Experiments And Analysis
Datasets.1 Aggregation-cluster
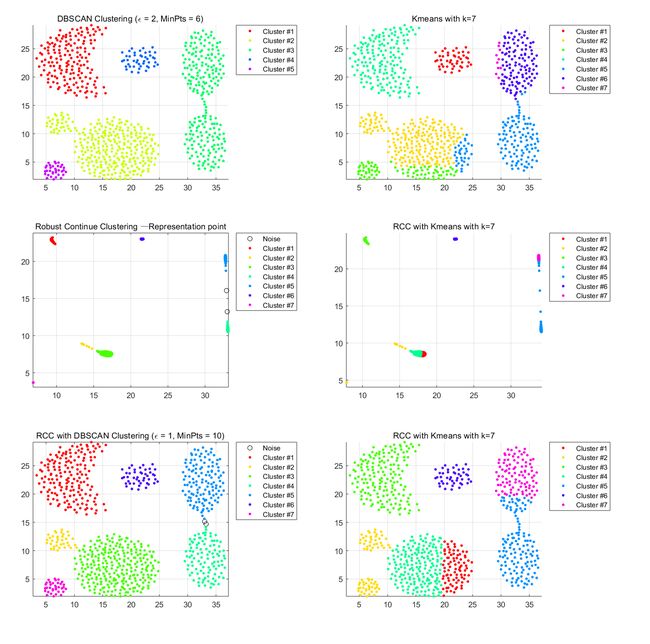
Left part:DBSCAN Right part:Kmeans:
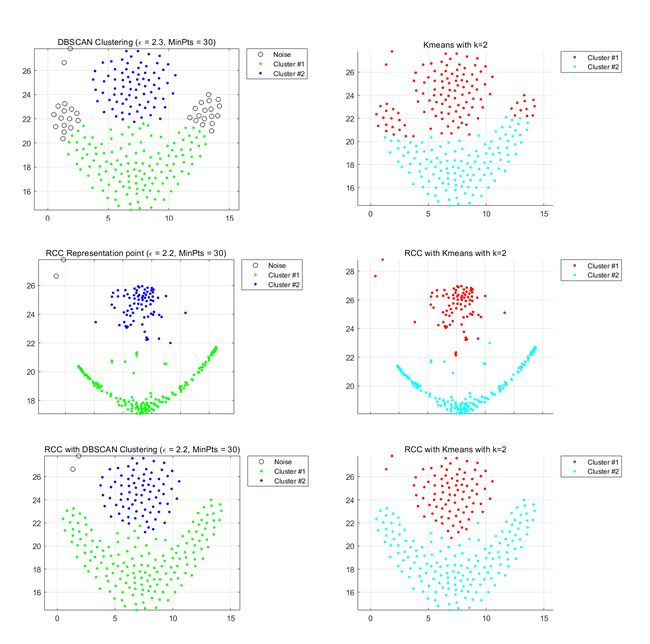
The characteristics of this data set are spherical distribution characteristics and obvious density characteristics, but the original data set seems to have some adhesion between clusters. The kmeans belong to the divisional clustering, so whether the clustering of the original dataset or the representative point clustering of the RCC learning is affected by the initial clustering center. DBSCAN is not able to be differentiated due to density because of sticking of data sets. This data set uses RCC to learn representative points and uses DBSCAN's clustering algorithm to perform the best. We can observe the middle graph.
The distinction between classes and classes is very obvious, and some adhesion conditions disappear. The points are very close together while maintaining the clustering characteristics of the original data set.
Datasets.2 flame-cluster
Left part:DBSCAN Right part:Kmeans
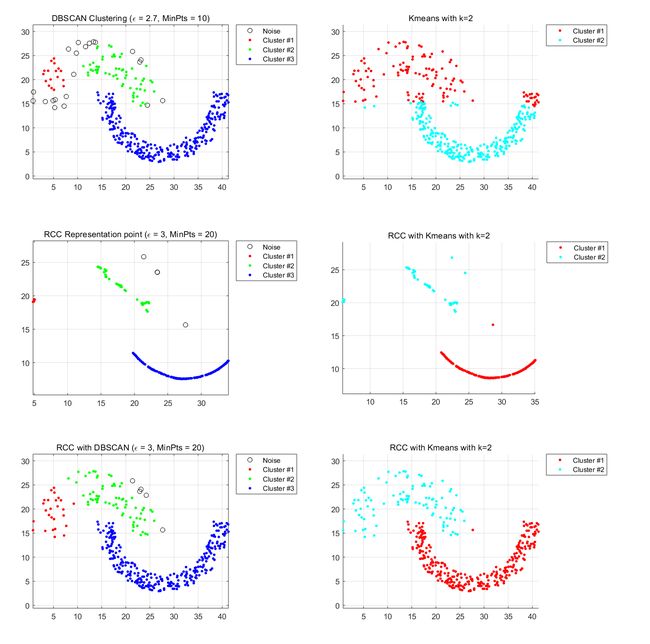
This data set looks like two types. Using kmeans for the original dataset does not achieve a good clustering effect because kmeans are linear clusters and cannot be divided by curves. Using DBSCAN clustering requires a very appropriate set of methods, otherwise it is likely to cluster into a cluster because of points in the data set.
After learning representative points through RCC, the clustering characteristics of the data set become more apparent. Whether it is through the density-based DBSCA algorithm or the partitioned Kmeans algorithm, a satisfactory result can be obtained.
Datasets.3 Jain-cluster
Left part:DBSCAN Right part:Kmeans
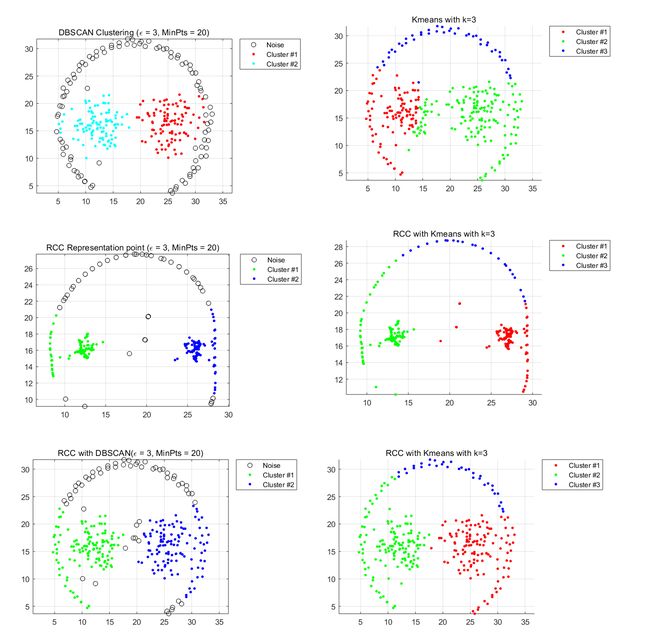
At rst glance, this dataset appears to be divided into two clusters. For the original dataset using DBSCAN and Kmeans, Kmeans performs better because the dataset classes do not overlap very much and can be split into two parts using partitioned clustering. Errors still occur near the boundaries of the sample points. . Using a certain set of parameters, dbscan divides the data set into three clusters that do
not meet the clustering requirements.
After using RCC to learn the sample points, it can be observed that the relationship between sample points is closer, and the clustering characteristics of the data set are more obvious. Accurate clustering results can easily be generated using the Kmeans algorithm. However, using DBSCAN, there will still be three types of situations. As can be seen from the distribution of representative points, there is a very tight spot on the left side. The performance of using DBSCAN is not as good as that of Kmeans.
Datasets.4 Pathbased-cluster
Left part:DBSCAN Right part:Kmeans
This is a dataset that I think is the most diffcult to cluster. This dataset has two characteristics. One is a spherical one and the other is a curved one. And these two characteristics are intertwined. Using DBSCAN algorithm is very easy to cluster into a cluster, or clustered into two clusters, or gathered into seven or eight clusters, because the density of the outermost part of the circle is really no law to follow.
The performance of kmeans is not too different from DBSCAN.
This dataset looks like a human face. The clustering in my mind is this: the middle two “eyes” are clustered into two clusters, and the outermost clusters are clustered.
Datasets.5 Spiral-cluster
Left part:DBSCAN Right part:Kmeans
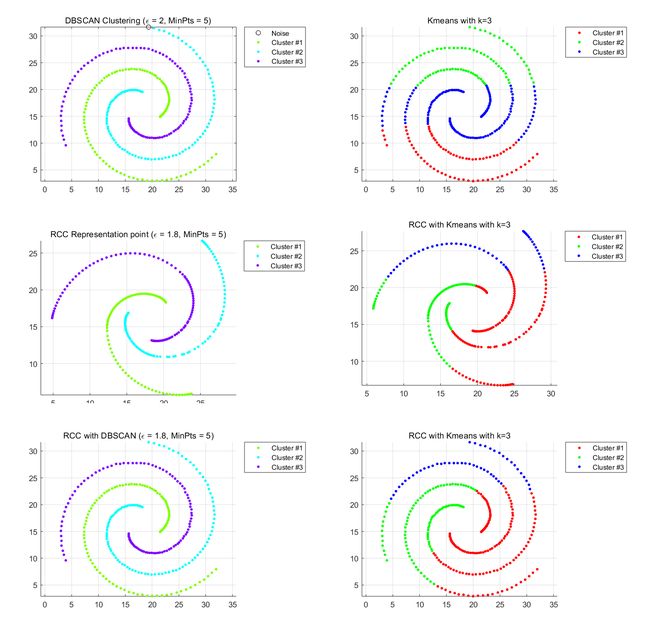
This data set is typically based on density clustering to get good results. Kmeans is a linear clustering method that cannot handle such datasets. The clustering result using DBSCAN is the same as the clustering result using RCC+DBSCAN. First, use kmeans and DBSCAN for clustering. If the clustering characteristics of the dataset are obvious, you do not need to use RCC to learn representative points. If the clustering characteristics of the data set are not suffciently distinguished, RCC can be used to learn the representative points, and then the two clustering methods are used to cluster the representative points.
Algorithm Evaluation
Mfeat has 2000 sample points, and the sample points have a dimension ranging from 6 to 300. The similarity matrix between the sample points is obtained, or the dimension of the distance matrix is 2000*2000, belonging to a data set with a relatively large dimension. In the test process, kmeans performed best. First, the calculation speed was fast, and the second accuracy was not low. The parameter
adjustment process of DBSCAN is very diffcult to control, and the number of clusters is also diffcult to control to 10 (handwritten data sets 0-9). By using DBSCAN and Kmeans after learning sample points through RCC, indicators such as accuracy are improved. As long as there are some good parameters, better clustering results can be achieved. However, RCC learning is costly and iterative learning enlarges. The matrix has a large dimension and the learning process takes a long time.
Algorithm Comparison and Hyperparameter
When kmeans species the number of clusters, it does not need to adjust any parameters, but kmeans may not be completely converged. In this case, the number of iterations can be articially dened. When we do not know the cluster number at all, we can actually implement the kmeans algorithm. I use the concept of split clustering and use kmeans to divide by two points until the similarity within a cluster reaches a threshold, or there is a clear difference between clusters. I have read a paper explaining how to use kmeans clustering for large-scale datasets in linear time.
DBSCAN parameters are more diffcult to adjust because of the need to adjust two parameters, radius and minimum density threshold. The concept of density reachable is both the advantage of DBSCAN and its disadvantages. Because DBSCAN does not need to specify the number of clusters, clustering can be performed based on the characteristics of the data set density as long as suitable parameters are available. But poorly selected parameters will lead to strange results. For example, if is too large and minPts is
too small, it is almost clustered into one cluster. If is too small and minPts is too large, it is all noise points. In this regard, the average distance between the point and the point and the average number of neighbors can be output, and the parameters can be adjusted more quickly. I have read a paper's method of adjusting parameters using genetic algorithms, a heuristic search method, to make adjustments.
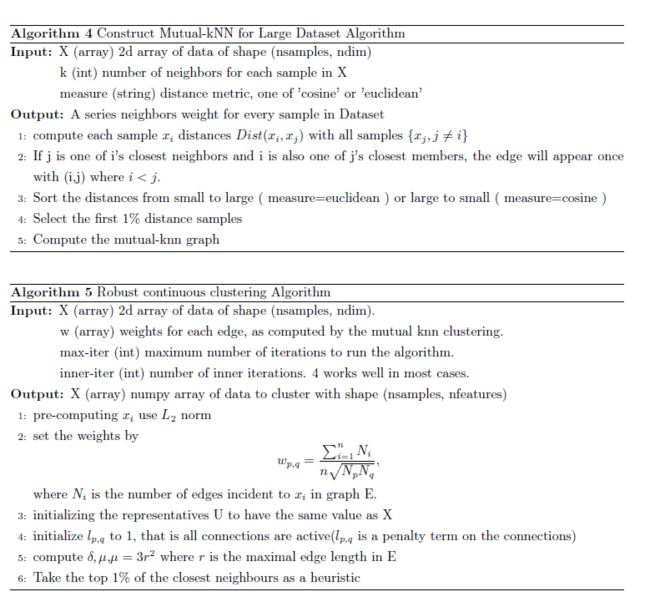
There are many parameters for the RCC, such as the construction of the MutualKnn diagram, the computation of the similarity W matrix, and the termination conditions of the algorithm convergence. When constructing a KNN map, MutualKnn is an undirected graph and needs to set a threshold . When the distance between sample points is greater than the distance, they are not connected. When the distance between sample points is less than ,it is considered as There is an edge between two sample
points. The formula for W is given in pseudocode. The algorithm can set such a convergence condition, initializing , is in MutualKnn.
In the experimentally given small data set, I think the best performing algorithm is the combination of RCC and Kmeans, followed by the combined algorithm of RCC and DBSCAN. Because the RCC learns the representative points of the original data set, it makes the clustering characteristics of the data set more obvious, that is, the similarity within the cluster is higher and the similarity between the clusters is lower, which is exactly The most desired result of the class.
The data set has a specied number of clusters, Kmeans can articially set the number of clusters. However, DBSCAN is determined by the density characteristics of the sample points. Usually, different parameters will correspond to different clustering results and are more diffcult to control.
It is more suitable to use Kmeans clustering with spherical features. Kmeans is based on clustering and does not perform well for distorted dataset features. DBSCAN happens to be able to adapt to this distorted distribution form. The dataset needs to have more obvious density characteristics, and DBSCAN is more applicable. However, DBSCAN can't correct the sample points like Kmeans.
Before the experiment, I used to think that kmeans is not a good algorithm. The resulting clustering results are random and not as stable as DBSCAN. However, for large data sets, Kmeans performs better than other algorithms. DBSCAN needs to use other information to adjust parameters. RCC learns representative points in an iterative manner and requires a long learning time. In terms of the execution effciency of the algorithm, kmeans is superior to DBSCAN and RCC algorithms if there is no support for computing clusters. However, if the accuracy of the time is viewed, the clustering algorithm using the representative points generated by RCC will have better clustering results.
The advantages of the K-means algorithm are:
First, the algorithm can prune the tree to determine the classication of some samples based on the class of less known cluster samples. Secondly, in order to overcome the inaccuracy of clustering of a small number of samples, K-means has the characteristics of iterative optimization, and iteratively corrects the pruning to determine the clustering of partial samples on the already obtained clusters. K-means optimizes the initial supervision. Learning where the sample classication is irrational; Third, the overall clustering time complexity can be reduced because only a small sample can be used.
The disadvantages of the K-means algorithm are:
First, K is given in advance in the K-means algorithm. The choice of this K value is very diffcult to estimate. Many times, it is not known in advance how many categories a given data set should be divided into; Second, in the K-means algorithm, it is rst necessary to determine an initial partition based on the initial cluster center, and then optimize the initial partition. The choice of this initial clustering center has a great in influence on the clustering result. Once the initial value is not selected well, it may not be able to obtain an effective clustering result; nally, the algorithm needs to continuously carry out sample classication adjustment and continuously calculate adjustments. After the new clustering center, when the amount of data is very large, the time overhead of the algorithm is very large. The K-means algorithm may lead to different results for different initial values. We can set a few different initial values and compare the results of the final operation until the result is stable.
The DBSCAN algorithm will have a suffcient density area as the distance center and continue to grow the area. The algorithm is based on the fact that a cluster can be uniquely determined by any core object in it. The DBSCAN algorithm uses the concept of density-based clustering, which requires that the number of objects (points or other spatial objects) contained within a certain area in the cluster space
is not less than a given threshold. This method can nd clusters of any shape in a noisy spatial database. It can connect neighboring areas with suffcient density and can effctively deal with abnormal data. It is mainly used to cluster spatial data. The advantages and disadvantages are summarized as follows:
DBSCAN algorithm advantages:
First, the clustering speed is fast and the noise points can be effectively dealt with and spatial clustering with arbitrary shape can be found. Second, compared with K-MEANS, there is no need to input the number of clusters to be divided; Third, there is no bias in the shape of clustering clusters; Fourth, you can enter the filter noise parameters when needed.
Disadvantages of the DBSCAN algorithm: First, when the amount of data increases, it requires a large memory support I/O consumption is also large; Second, when the spatial clustering density is uneven and the cluster spacing difference is very different, the clustering quality is poor, because the parameters MinPts and Eps are diffcult to select in this case. Third, the algorithm depends on the clustering effect and distance formula selection, the actual application of commonly used Euclidean distance,for high-dimensional data, there is "dimensional disaster."
