机器学习之监督算法(一)
机器学习监督算法
- 机器学习常用算法
- 一.回归算法
- 1.最小二乘法
- 1)定义
- 2)解法
- 3)代码实现
- 2.梯度下降法求解多元线性回归
- 1)例子——参考西瓜书
- 2)梯度下降算式推导过程
- 3)代码实现
- 二.分类算法
- 1.KNN(K近邻算法)
- 1)概念
- 2)距离
- 3)算法步骤
- 4)代码实现
- 2.逻辑斯蒂回归
- 1)作用场景
- 2)函数选择
- 3)案例
- 4)判断逻辑
- 5)损失函数
- 3.决策树
- 1)熵
- 2)条件熵
- 3)信息增益
- 4)常见算法
机器学习常用算法
一.回归算法
1.一元线性回归
- 存在y=ax+b的模型,称之为一元线性回归
2.多元线性回归 - 形如f(x)=w1x1+w2x2+w3x3+b的这种存在多个变量的线性回归,称之为多元线性回归.
- 可以将其写成一个向量表达形式:f(x)=wtxb
1.最小二乘法
1)定义
2)解法
3)代码实现
   # coding="utf-8"

    # 引入依赖
    import numpy as np;
    import matplotlib.pyplot as plt;

    # 导入数据
    datas = np.genfromtxt("E:\CodeStudy\PythonCode\Demo01\data\data.csv", delimiter=',')

    # 提取datas中的两列数据,分别作为x和y
    x = datas[:, 0]
    y = datas[:, 1]


    # 定义损失函数,传入wb,和数据
    def comput_cos(w, b, datas):
        total_cost = 0
        M = len(datas)

        # 逐点计算平方损失误差,然后求平均数
        for i in range(M):
            x = datas[i, 0]
            y = datas[i, 1]

            total_cost += (y - w * x - b) ** 2

        return total_cost / M;


    # 定义一个算法拟合函数,先定义求均值的函数ava
    def average(data):
        sum = 0
        num = len(data)
        for i in range(num):
            sum += data[i]
        return sum / num;


    # 定义核心拟合函数
    def fit(datas):
        M = len(datas)
        x_bar = average(datas[:, 0])

        sum_yx = 0;
        sum_x2 = 0;
        sum_delta = 0;
        for i in range(M):
            x = datas[i, 0]
            y = datas[i, 1]
            sum_yx += y * (x - x_bar)
            sum_x2 += x ** 2

        # 根据公式去算w和b
        w = sum_yx / (sum_x2 - M * (x_bar ** 2))

        for i in range(M):
            x = datas[i, 0]
            y = datas[i, 1]
            sum_delta += (y - w * x)

        b = sum_delta / M

        return w, b


    if __name__ == '__main__':
        # 测试
        w, b = fit(datas)
        cost = comput_cos(w, b, datas)
        print("w is", w)
        print("y is", b)
        print("cost is", cost)
        # 画出拟合曲线
        plt.scatter(x, y)
        # 针对每一个x算出预测的y
        pred_y = w * x + b
        plt.plot(x, pred_y, c="r")
        plt.show()
2.梯度下降法求解多元线性回归
1)例子——参考西瓜书
现实生活中大多数问题都存在多个变量,因此函数表达式可以假设为
f好瓜(x)=0.3x瓜皮+0.5x瓜蒂+0.2x声音+1 这类型的公式,存在多个变量。
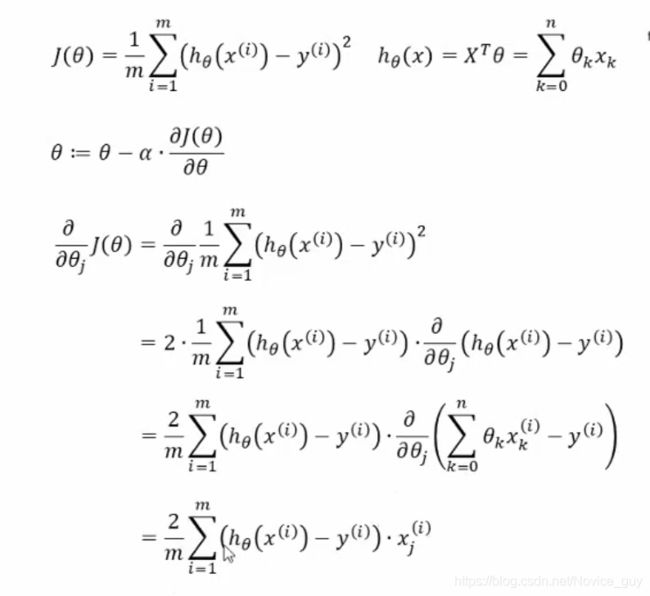
2)梯度下降算式推导过程
-
实现原理:与最小二乘法相同,算出某个点所有偏导的和,然后指定一个向量,带入求出的式子中,解出当前变化率最大的点,然后再以这个点为起始点再次计算,重读迭代。
-
α的定值:α在梯度下降算法中代表着步长/即学习率,合适的α可以保证收敛速度,同时可以防止下降速度过快,跨过最低点,因此α对于梯度下降算法是尤为重要的。

3)代码实现
# coding=utf-8
import numpy as np
import pandas as pd
import matplotlib.pyplot as plt

# 导入数据
datas = np.genfromtxt("E:\CodeStudy\PythonCode\Demo01\data\data.csv", delimiter=',')

# 定义模型参数
alpha = 0.0001
init_w = 0
init_b = 0

# 定义迭代次数
num_iter = 10;

# 提取datas中的两列数据,分别作为x和y
x = datas[:, 0]
y = datas[:, 1]


# 定义损失函数,传入wb,和数据
def comput_cost(w, b, datas):
    total_cost = 0
    M = len(datas)

    # 逐点计算平方损失误差,然后求平均数
    for i in range(M):
        x = datas[i, 0]
        y = datas[i, 1]

        total_cost += (y - w * x - b) ** 2

    return total_cost / M;


# 梯度下降核心算法
def grad_desc(datas, init_w, init_b, alpha, num_iter):
    w = init_w
    b = init_b

    # 定义一个list保存所有损失数字
    cost_list = []

    for i in range(num_iter):
        cost_list.append(comput_cost(w, b, datas))
        w, b = step_grad_desc(w, b, alpha, datas)

    return w, b, cost_list


# 获得每次迭代过程中的梯度值
def step_grad_desc(current_w, current_b, alpha, datas):
    sum_grad_w = 0
    sum_grad_b = 0

    M = len(datas)

    for i in range(M):
        x = datas[i, 0]
        y = datas[i, 1]

        sum_grad_w += (current_w * x + current_b - y) * x
        sum_grad_b += current_w * x + current_b - y

    grad_w = 2 / M * sum_grad_w
    grad_b = 2 / M * sum_grad_b

    up_dated_w = current_w - alpha * grad_w
    up_dated_b = current_b - alpha * grad_b

    return up_dated_w, up_dated_b


# 测试函数

def testAlg():
    res_w, res_b, cost_list = grad_desc(datas, init_w, init_b, alpha, num_iter)
    print("res_w = ", res_w)
    print("res_b = ", res_b)
    print("cost_list = ", cost_list)

    # plt.plot(cost_list, c="r")
    # plt.show()

    plt.scatter(x, y)

    pred_y = res_w * x + res_b

    plt.scatter(x,pred_y,c="r")

    plt.show()


if __name__ == '__main__':
    testAlg()
二.分类算法
1.KNN(K近邻算法)
1)概念
- 离样本最近的k个值归属哪一类最多,该样本就属于哪一类,通常k不大于20且最好取奇数。
2)距离
- 计算距离采用欧氏距离或者曼哈顿距离
3)算法步骤
- 计算测试距离与各个训练数据之间的距离->按照距离的远近排序->选取距离最小的K个点->确定前k个点所在类别的出现频率->返回前k个点中出现频率最高的类别作为测试数据的预测分类。
4)代码实现
# encoding=utf-8
import numpy as np
import pandas as pd
from sklearn.datasets import load_iris
from sklearn.model_selection import train_test_split  # 切分数据集和训练集
from sklearn.metrics import accuracy_score  # 准确率->计算分类预测的准确率

# 直接引入sklearn中的数据值,iris数据
iris = load_iris()

# 通过pandas将iris数据转化为dataframe
df = pd.DataFrame(data=iris.data, columns=iris.feature_names)

# 将分类信息和分类要求添加到数据后面
df['class'] = iris.target
df['class'] = df['class'].map({0: iris.target_names[0], 1: iris.target_names[1], 2: iris.target_names[2]})

# 拿到数据的x和y
x = iris.data
y = iris.target.reshape(-1, 1)

# 划分数据集和训练集
# test_size = 测试集的比例  random_state=随即种子 stratify= 按照y的类数,进行相同比例的分割
x_train, x_test, y_train, y_test = train_test_split(x, y, test_size=0.3, random_state=35, stratify=y)


# 核心算法
# 距离函数算法
def l1_distance(a, b):
    return np.sum(np.abs(a - b), axis=1)


def l2_distance(a, b):
    return np.sqrt(np.sum(a - b) ** 2, axis=1)


class kNN(object):
    # 定义一个初始化方法
    def __init__(self, k_num=1, dist_fuc=l1_distance):
        self.k_num = k_num
        self.dist_fuc = l1_distance

    # 一般训练模型方法
    def fit(self, x, y):
        self.x_train = x
        self.y_train = y

    def predict(self, x):
        # 初始化预测分类数组
        y_pred = np.zeros((x.shape[0], 1), dtype=self.y_train.dtype)

        # 取出序号i和具体数值x_test
        for i, x_test in enumerate(x):
            # 求出所有数据与x_test的距离
            distance = self.dist_fuc(self.x_train, x_test)
            # 排序取出索引值
            nn_index = np.argsort(distance)
            # 选最小的k个点进行操作
            nn_y = self.y_train[nn_index[:self.k_num]].ravel()
            # 按出现频率取最多的,赋给y_pred
            y_pred[i] = np.argmax(np.bincount(nn_y))

        return y_pred


# 主程序测试
if __name__ == '__main__':
    knn = kNN(k_num=5,dist_fuc = l2_distance)

    knn.fit(x_train, y_train)

    y_pred = knn.predict(x_test)

    accuracy = accuracy_score(y_test, y_pred)
    print(accuracy)
2.逻辑斯蒂回归
1)作用场景
预测一个肿瘤是否是癌症的方法,使用线性回归的劣势:健壮性不足,极容易收到噪声干扰,对于断崖式的增长/下降无法较好的拟合。
逻辑斯蒂回归就是用回归的方法拟合到一条或多条曲线作为分类边界。
2)函数选择
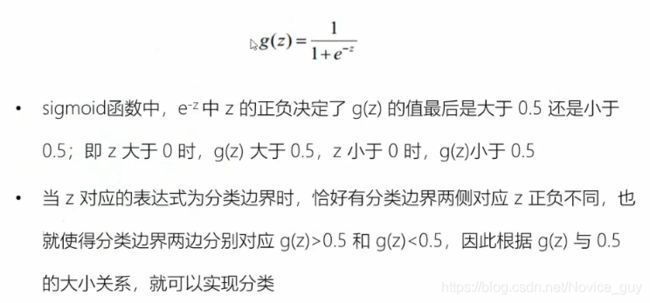
sigmoid函数(压缩函数):极限z越大越逼近1,z越小越逼近0。

3)案例
4)判断逻辑
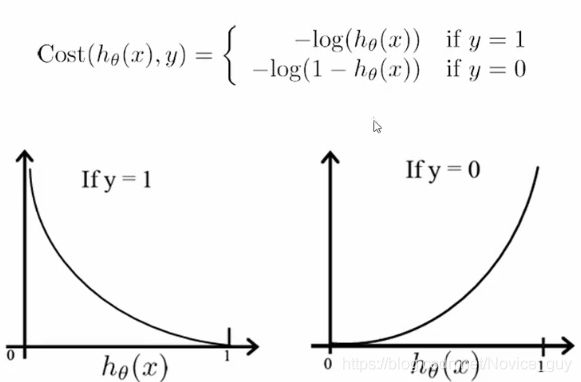
5)损失函数
代码思路和上面的回归思路相同,对损失函数求解,但是需要考虑到,这个地方即使建立了线性模型,因为sigmoid函数存在,因此我们最终得到的结果还是离散性的0-1
3.决策树
决策树是一种简单高效,且具有强解释性的模型,广泛应用于数据分析领域,本质上就是针对某些特性去判断是否符合要求。
决策树的本质上更倾向于if-then这个格式,所有的条件(condition)互相之间是互斥并且完备。
现实生活中可能存在相互矛盾得结果,比如相同条件下出现了不同结果,因此我们可以将决策树看成条件概率,将目标分到条件概率更大得那一类中。
1)熵
2)条件熵
3)信息增益
- 经验熵和条件熵的差值,是评价决策树效果的一个关键元素,信息增益越大,决策树越优秀
4)常见算法
-
ID3算法
-
C4.5算法
-
分类和回归树(CRAT):特征选择+树的生成+剪枝


