python机器学习 第三章(2)基于逻辑回归的分类概率模型
参考:https://github.com/PacktPublishing/Python-Machine-Learning-Second-Edition
逻辑回归的直觉与条件概率
逻辑回归在线性可分类上表现不错。逻辑回归模型也可以通过OvR技术扩展到多元分类
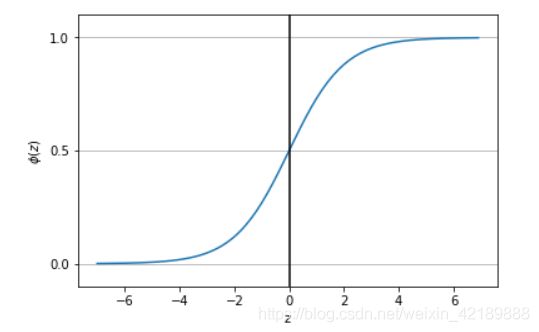
*让步比:有利于某一特定事件的概率,可以定义为p/(1-p),p代表阳性事件的概率。进一步定义logit函数,logit§=log p/(1-p) 用此函数表示与特征值的线性关系。在机器学习中sigmoid函数是常用的激活函数之一,其表达式为1/(1+e^-z)其中z为净输入,也即特征与权重积之和。我们用matplotlib中的pyplot可以绘制出此函数的图像。
import matplotlib.pyplot as plt
import numpy as np

def sigmoid(z):
    return 1.0/(1.0+np.exp(-z))

z=np.arange(-7,7,0.1)
phi_z=sigmoid(z)
plt.plot(z,phi_z)
plt.axvline(0.0,color='k')
plt.ylim(-0.1,1.1)
plt.xlabel('z')
plt.ylabel('$\phi (z)$')
plt.yticks([0.0,0.5,1.0])
ax=plt.gca()
ax.yaxis.grid(True)
plt.show()

从图中可以看出sigmoid函数的特点。当z趋向正无穷大时,此函数趋向于1,当z趋向于负无穷时,此函数值趋向于0.
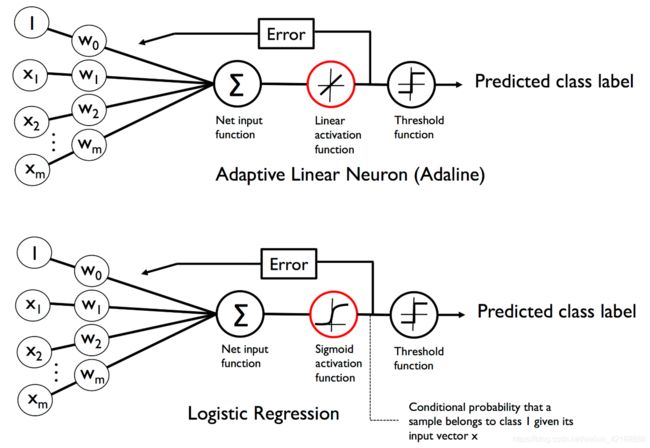
可以与之前的Adaline模型联系起来,Adaline模型的激活函数为 ϕ ( z ) = z \phi (z)=z ϕ(z)=z,而在逻辑回归中,激活函数变成了sigmoid函数对比如下图:

Sigmoid函数计算并输出样本为标签1的概率。例如对某种花的样本,计算出其sigmoid函数值为0.8,则样本属于标签1类的机会为80%。显然其属于标签0的机会为20%。预测概率可以简单的通过阈值函数转换为二元输出。比如如果函数值大于0.5为标签1,反之为标签0。
事实上许多应用不仅仅只满足于预测分类标签,还需要评估类中的成员概率。比如输入到阈值函数的sigmoid函数输出。
逻辑代价函数的权重
接下来要知道如何拟合模型参数,例如上一章里的权重。上一章定义平方和的误差代价函数为:
j ( w ) = ∑ 1 2 ( ϕ ( z i ) − y i ) 2 j(w)=\sum\frac 1 2(\phi(z^i)-y^i)^2 j(w)=∑21(ϕ(zi)−yi)2
要解释如何得到逻辑回归的代价函数,需要首先定义在建立逻辑回归模型时想要最大化的可能性L

在实践中,最大化该方程的自然对数(对数似然函数):

首先用对数函数降低了数值下溢的可能性,此情况在概率很小的情况下发送。其次,如此转化后可以很方便地求该函数的导数。
现在可以用诸如梯度上升等优化算法来最大化这个对数似然函数。另一个选择是重写对数似然函数作为代价函数J,像在上一章中那样用梯度下降方法最小化代价函数。

如果正确地预测样本,代价就会接近0;如果预测错误,代价会越来越大。关键在于用越来越大的代价惩罚错误的预测。
要实现逻辑回归,可以用新的代价函数取代上一章的代价函数J
class LogisticRegressionGD(object):
    """Logistic Regression Classifier using gradient descent.
    Parameters
    ------------
    eta : float
      Learning rate (between 0.0 and 1.0)
    n_iter : int
      Passes over the training dataset.
    random_state : int
      Random number generator seed for random weight
      initialization.
    Attributes
    -----------
    w_ : 1d-array
      Weights after fitting.
    cost_ : list
      Sum-of-squares cost function value in each epoch.
    """
    def __init__(self, eta=0.05, n_iter=100, random_state=1):
        self.eta = eta
        self.n_iter = n_iter
        self.random_state = random_state

    def fit(self, X, y):
        """ Fit training data.
        Parameters
        ----------
        X : {array-like}, shape = [n_samples, n_features]
          Training vectors, where n_samples is the number of samples and
          n_features is the number of features.
        y : array-like, shape = [n_samples]
          Target values.
        Returns
        -------
        self : object
        """
        rgen = np.random.RandomState(self.random_state)
        self.w_ = rgen.normal(loc=0.0, scale=0.01, size=1 + X.shape[1])
        self.cost_ = []

        for i in range(self.n_iter):
            net_input = self.net_input(X)
            output = self.activation(net_input)
            errors = (y - output)
            self.w_[1:] += self.eta * X.T.dot(errors)#注意这里.T是转置,dot是点乘
            #看不懂可以参考https://zhidao.baidu.com/question/811675877155828172.html
            self.w_[0] += self.eta * errors.sum()

            # note that we compute the logistic `cost` now
            # instead of the sum of squared errors cost
            cost = -y.dot(np.log(output)) - ((1 - y).dot(np.log(1 - output)))
            self.cost_.append(cost)
        return self

    def net_input(self, X):
        """Calculate net input"""
        return np.dot(X, self.w_[1:]) + self.w_[0]

    def activation(self, z):
        """Compute logistic sigmoid activation"""
        return 1. / (1. + np.exp(-np.clip(z, -250, 250)))

    def predict(self, X):
        """Return class label after unit step"""
        return np.where(self.net_input(X) >= 0.0, 1, 0)
        # equivalent to:
        # return np.where(self.activation(self.net_input(X)) >= 0.5, 1, 0)
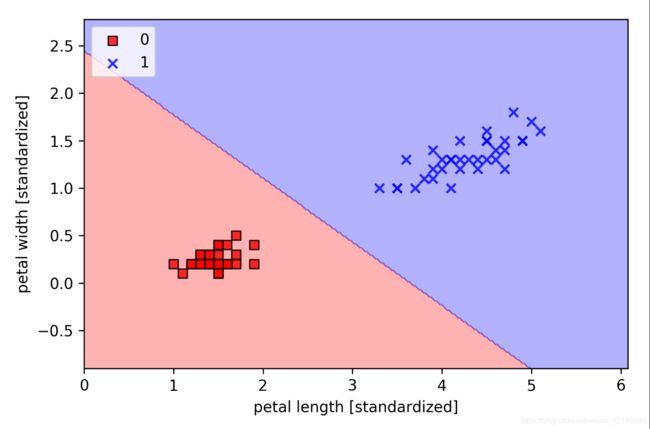
拟合逻辑回归模型时,记住该模型只适用于二元分类。所以考虑0.1验证其有效性。
X_train_01_subset = X_train[(y_train == 0) | (y_train == 1)]
y_train_01_subset = y_train[(y_train == 0) | (y_train == 1)]

lrgd = LogisticRegressionGD(eta=0.05, n_iter=1000, random_state=1)
lrgd.fit(X_train_01_subset,
         y_train_01_subset)

plot_decision_regions(X=X_train_01_subset, #上节代码
                      y=y_train_01_subset,
                      classifier=lrgd)

plt.xlabel('petal length [standardized]')
plt.ylabel('petal width [standardized]')
plt.legend(loc='upper left')

plt.tight_layout()
#plt.savefig('images/03_05.png', dpi=300)
plt.show()
