seaborn教程——散点图
Seaborn是一个基于matplotlib的Python数据可视化库。它提供了一个高层次的界面,用于绘制有吸引力和信息丰富的统计图形。
引入数据集
import seaborn as sns
import matplotlib
import numpy as py
import pandas as pd
from sklearn import datasets

tips = sns.load_dataset("tips")
>>>tips[0:5]
Out[2]:
   total_bill   tip     sex smoker  day    time  size
0       16.99  1.01  Female     No  Sun  Dinner     2
1       10.34  1.66    Male     No  Sun  Dinner     3
2       21.01  3.50    Male     No  Sun  Dinner     3
3       23.68  3.31    Male     No  Sun  Dinner     2
4       24.59  3.61  Female     No  Sun  Dinner     4
配色方案seaborn.color_palette
格式:seaborn.color_palette(palette=None, n_colors=None, desat=None)
有现成的配色方案,也可以自己用“b”“r”来选颜色,详见:http://seaborn.pydata.org/generated/seaborn.color_palette.html#seaborn.color_palette
http://seaborn.pydata.org/tutorial/color_palettes.html#palette-tutorial
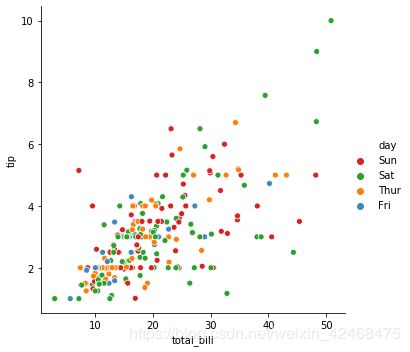
也可以自己决定配色方案
先选定想要的RGB颜色,比如红色是#62425,把想要的颜色装入列表,最后用 palette参数就可以了
# 依次是:红绿橙蓝
color_list = ["#D62425","#2CA02C","#FF7D0A","#3D89BE"]
ax = sns.relplot(x="total_bill", y="tip", hue="day", palette=color_list,data=tips)
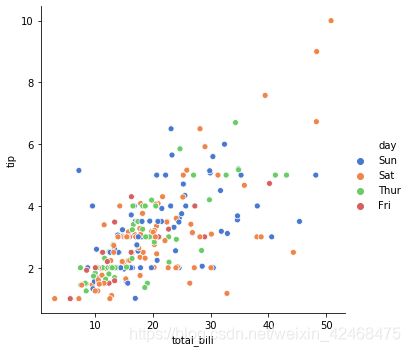
还有一种方法是从原有的配色方案选取你想要的颜色:
current_palette = sns.color_palette("muted", n_colors=4)
"""
current_palette是三个元素元组形式的RGB颜色:
[(0.2823529411764706, 0.47058823529411764, 0.8156862745098039),
 (0.9333333333333333, 0.5215686274509804, 0.2901960784313726),
 (0.41568627450980394, 0.8, 0.39215686274509803),
 (0.8392156862745098, 0.37254901960784315, 0.37254901960784315)]
"""
color_list = sns.color_palette(current_palette).as_hex()
"""
color_list 是带有#表示的颜色:
['#4878d0', '#ee854a', '#6acc64', '#d65f5f']
"""
ax = sns.relplot(x="total_bill", y="tip", hue="day", palette=color_list,data=tips)
散点图
格式:seaborn.scatterplot(x=None, y=None, hue=None, style=None, size=None, data=None, palette=None, hue_order=None, hue_norm=None, sizes=None, size_order=None, size_norm=None, markers=True, style_order=None, x_bins=None, y_bins=None, units=None, estimator=None, ci=95, n_boot=1000, alpha=‘auto’, x_jitter=None, y_jitter=None, legend=‘brief’, ax=None, **kwargs)
参数:
x, y:names of variables in data or vector data, optional
Input data variables; must be numeric. Can pass data directly or reference columns in data.
hue:可放入第三维数据,name of variables in data or vector data, optional
Grouping variable that will produce points with different colors. Can be either categorical or numeric, although color mapping will behave differently in latter case.
size:可放入第三维数据,name of variables in data or vector data, optional
Grouping variable that will produce points with different sizes. Can be either categorical or numeric, although size mapping will behave differently in latter case.
style:可放入第三维数据,和markers参数对应,name of variables in data or vector data, optional
Grouping variable that will produce points with different markers. Can have a numeric dtype but will always be treated as categorical.
data:DataFrame
Tidy (“long-form”) dataframe where each column is a variable and each row is an observation.
palette:palette name, list, or dict, optional
Colors to use for the different levels of the hue variable. Should be something that can be interpreted by color_palette(), or a dictionary mapping hue levels to matplotlib colors.
sizes:可放入第三维数据,list, dict, or tuple, optional
An object that determines how sizes are chosen when size is used. It can always be a list of size values or a dict mapping levels of the size variable to sizes. When size is numeric, it can also be a tuple specifying the minimum and maximum size to use such that other values are normalized within this range.
markers:boolean, list, or dictionary, optional
Object determining how to draw the markers for different levels of the style variable. Setting to True will use default markers, or you can pass a list of markers or a dictionary mapping levels of the style variable to markers. Setting to False will draw marker-less lines. Markers are specified as in matplotlib.
ci:绘画置信区间,int or “sd” or None, optional
Size of the confidence interval to draw when aggregating with an estimator. “sd” means to draw the standard deviation of the data. Setting to None will skip bootstrapping. Currently non-functional.
Examples:
1.非常普通的二维数据的散点图
ax = sns.scatterplot(x="total_bill", y="tip", data=tips)
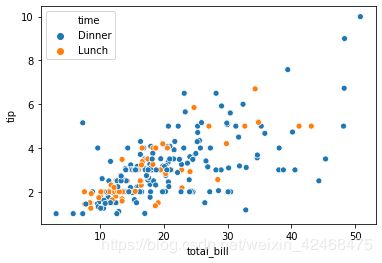
2.通过hue参数加入第三维数据
ax = sns.scatterplot(x="total_bill", y="tip", hue="time", data=tips)

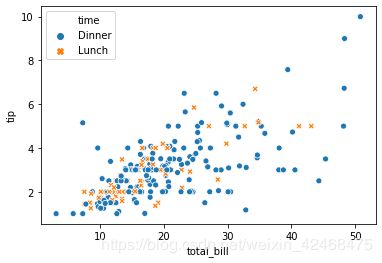
3.style参数可以给指定列加上别的风格(一般指markers)
ax = sns.scatterplot(x="total_bill", y="tip", hue="time", style="time", data=tips)

4.hue和style可以指代不同的列,前者控制颜色,后者控制形状
ax = sns.scatterplot(x="total_bill", y="tip", hue="time", style="sex", data=tips)

5.size参数也可以指代一列参数,用点的大小呈现区分
size参数还可以用sizes参数改变最大最小值:sizes=(20, 200)
ax = sns.scatterplot(x="total_bill", y="tip",size="size",data=tips)

6.palette参数控制调色板,和hue参数搭配
注意和上面那个图的区别
cmap = sns.cubehelix_palette(dark=.3, light=.8, as_cmap=True)
ax = sns.scatterplot(x="total_bill", y="tip", size="size",hue="size",data=tips, palette=cmap)
markers = {"Lunch": "s", "Dinner": "X"}
ax = sns.scatterplot(x="total_bill", y="tip", style="time",data=tips,markers=markers)

marker还可以用别的符号:marker="+"
8.根据某列数据分成几类图:
ax = sns.relplot(x="total_bill", y="tip", hue="day", style="day", col="time",data=tips)

参考:
http://seaborn.pydata.org/generated/seaborn.scatterplot.html#seaborn.scatterplot


