angular5引入折线图
1)安装插件
npm install echarts -S
npm install ngx-echarts -S
npm install @types/echarts -D
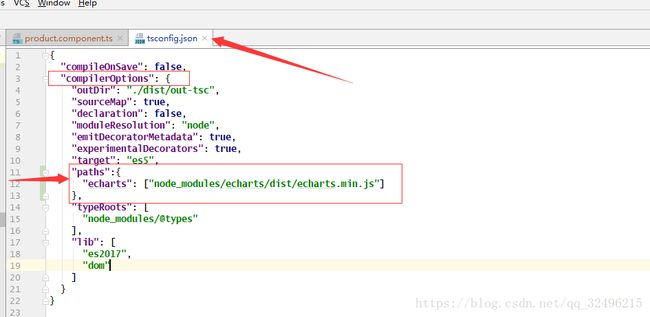
2)修改tsconfig.json文件
tsconfig.json---->complierOptions中添加
  "paths":{
              "echarts": ["node_modules/echarts/dist/echarts.min.js"]
            },
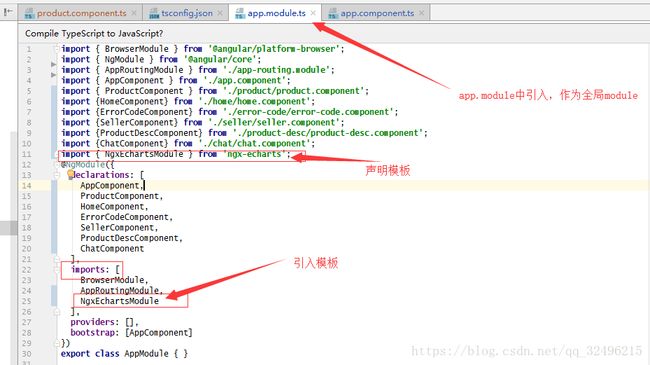
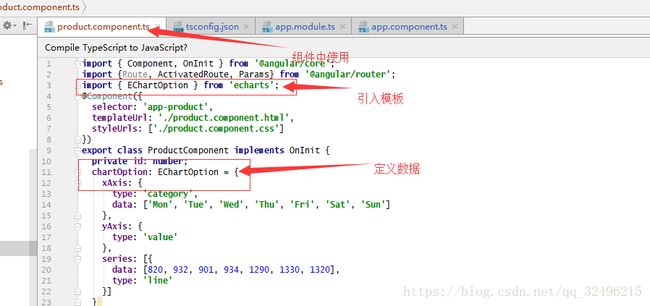
import { NgxEchartsModule } from 'ngx-echarts';
app.modules.ts–>@NgModule–>imports中添加NgxEchartsModule
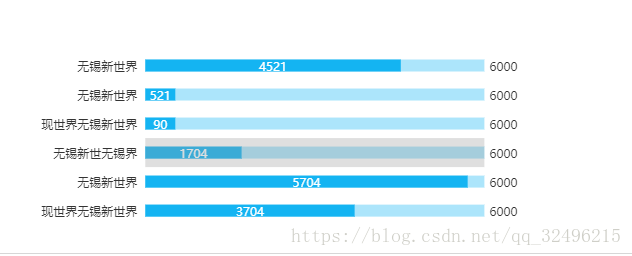
option= {
    tooltip : {
      trigger: 'axis',
      axisPointer : {            // 坐标轴指示器,坐标轴触发有效
        type : 'shadow'        // 默认为直线,可选为:'line' | 'shadow'
      }
    },
    grid: {
      left: '10%',
      right: '14%',
      bottom: '3%',
      containLabel: true
    },
    xAxis:  {
      type: 'value',
      show: false, //将x轴隐藏
    },
    yAxis: {
      axisLine: {
        show: false
      }, // y轴坐标轴线隐藏,注意不是y轴隐藏,我们还要显示文字的
      axisTick: [{
        show: false
      }], // y轴坐标轴刻度隐藏
      type: 'category',
      data: ['现世界无锡新世界','无锡新世界','无锡新世无锡界','现世界无锡新世界','无锡新世界','无锡新世界']
    },
    series: [
      {
        type: 'bar',
        data:[6000.0,6000.0,6000.0,6000.0,6000.0,6000.0],
        tooltip: { show: false},
        barMinHeight: 30, //最小柱高
        barWidth: 12, // 柱宽度
        z: 10, // 控制图表前后顺序
        barGap: '-100%',

        itemStyle: { // 柱子样式
          normal: {
            color: 'rgba(172,229,251,1)', // 柱状图颜色
            label: {
                show: true, // 显示文本
                color:'rgba(51,51,51,1)',
                position:'right'
            }
          }
        }
      },
      {
        type: 'bar',
        data:[3704.0,5704.0,1704.0,90.0,521.0,4521.0],
        tooltip: { show: false},
        barMinHeight: 30, //最小柱高
        barWidth: 12, // 柱宽度
        z: 10, // 控制图表前后顺序
        itemStyle: { // 柱子样式
          normal: {
            color: 'rgba(20,180,242,1)', // 柱状图颜色
            label: {
              show: true, // 显示文本
              color:'rgba(255,255,255,1)'
            }
          }
        }
      },


    ]
  };


