使用Statsmodels在Python中进行重复测量方差分析
In this brief Python data analysis tutorial we will learn how to carry out a repeated measures ANOVA using Statsmodels. More specifically, we will learn how to use the AnovaRM class from statsmodels anova module.
在这个简短的Python数据分析教程中,我们将学习如何使用Statsmodels执行重复测量方差分析。 更具体地说,我们将从statsmodels anova模块中学习如何使用AnovaRM类。
To follow this guide you will need to have Python, Statsmodels, Pandas, and their dependencies installed. One easy way to get these Python packages installed is to install a Python distribituion such as Anaconda (see this YouTube Video on how to install Anaconda). However, if you already have Python installed you can of course use Pip.
要遵循本指南,您将需要安装Python,Statsmodels,Pandas及其依赖项。 安装这些Python软件包的一种简单方法是安装Python发行版,例如Anaconda( 有关如何安装Anaconda的信息,请参见此YouTube视频 )。 但是,如果您已经安装了Python,则当然可以使用Pip。
How to carry out repeated measures ANOVA using other Python packages:
如何使用其他Python软件包执行重复测量方差分析:
- Repeated Measures ANOVA using Python
- Two-way ANOVA for repeated measures using Python
- 使用Python的重复测量方差分析
- 使用Python进行重复测量的双向方差分析
This short tutorial are devided so that we will learn how to install Statsmodels and Pandas, carrying out one-way and two-way ANOVA using statsmodels. Finally, there is a YouTube video showing how to carry out repeated measures ANOVA using Statsmodels and R. This Youtube video will also show some of the differences between Statsmodel and the r-package afex and the function aov_ez.
提供此简短教程的目的是,我们将学习如何安装Statsmodels和Pandas,并使用statsmodels执行单向和双向ANOVA。 最后,有一个YouTube视频,展示了如何使用Statsmodels和R执行重复测量ANOVA。该YouTube视频还将显示Statsmodel与r-package afex和函数aov_ez之间的一些区别。
如何安装Statsmodels和Pandas (How to Install Statsmodels & Pandas)
Statsmodels and Panda can easily be installed using pip:
可以使用pip轻松安装Statsmodels和Panda:
pip install pandas statsmodels
如何使用AnovaRM进行重复测量ANOVA (How to Use AnovaRM to Carry Out a Repeated Measures ANOVA)
In this section we are going to learn how to do a repeated measures ANOVA using Statsmodels. More specifically, we are going to learn how carry out a one-way ANOVA and two-way ANOVA in Python. The AnovaRM clas takes five arguments:
在本节中,我们将学习如何使用Statsmodels进行重复测量ANOVA。 更具体地说,我们将学习如何在Python中执行单向ANOVA和两向ANOVA。 AnovaRM类别有五个参数:
- data: the first argument should be a dataframe object.
- depvar: second should variable should be your dependent variable. Should be a string (e.g., ‘responsetime’)
- subject: here you put in your subject identifier. Should also be a string (e.g., ‘subject’)
- within: the within-subject factors in a lit of strings.
- aggregate_func: this is optional and should be use if the data contains more than a single observation per participant. Can be “mean” or a function. For instance, you can use Numpy mean (i.e., np.mean).
- data :第一个参数应该是一个数据框对象。
- depvar :第二应该变量应该是您的因变量。 应该是一个字符串(例如“ responsetime”)
- subject :在这里您输入您的主题标识符。 也应该是一个字符串(例如,“ subject”)
- 内部 :一串字符串中的主题内因素。
- Aggregate_func :这是可选的,如果每个参与者的数据中包含多个观察值,则应使用该函数。 可以是“均值”或函数。 例如,您可以使用Numpy均值(即np.mean)。
使用Statsmodels进行重复测量的单向方差分析 (One-way ANOVA for Repeated Measures Using Statsmodels)
First we start with the one-way ANOVA. In the examples below we are going to use Pandas and the AnovaRM class from statsmodels. In the first example, we are using Pandas to use read_csv to load this data into a dataframe. See my Python Pandas Dataframe tutorial if you need to learn more about Pandas dataframes.
首先,我们从单向方差分析开始。 在下面的示例中,我们将使用statsmodels中的Pandas和AnovaRM类。 在第一个例子中,我们使用熊猫使用read_csv加载这个数据到一个数据帧。 如果您需要了解有关Pandas数据框的更多信息,请参见我的Python Pandas数据框教程 。
import pandas as pd
from statsmodels.stats.anova import AnovaRM

df = pd.read_csv('rmAOV1way.csv')
We can use Pandas head() to have a look at the first five row (i.e., df.head()):
我们可以使用Pandas head()来查看前五行(即df.head()):
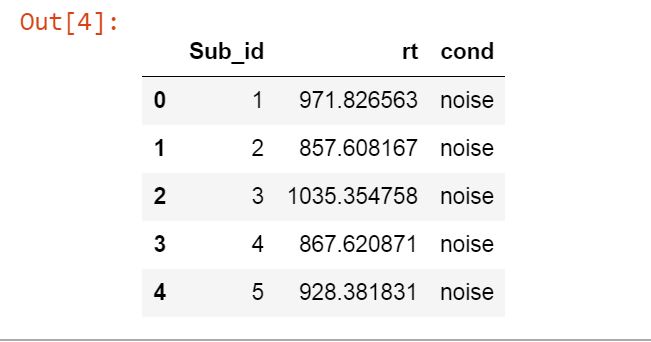
As can be seen above we have the columns Sub_id, rt, and cond. These columns represent the subject identifier, the dependent variable, and the independent variable, respectively. Note, there are two levels of cond (using df.cond.unique() will show us noise and quiet).
如上所示,我们有Sub_id,rt和cond列。 这些列分别代表主题标识符,因变量和自变量。 注意,cond有两个级别(使用df.cond.unique()会向我们展示噪音和安静程度)。
Python单向重复测量方差分析示例: (Python One-way Repeated Measures ANOVA Example:)
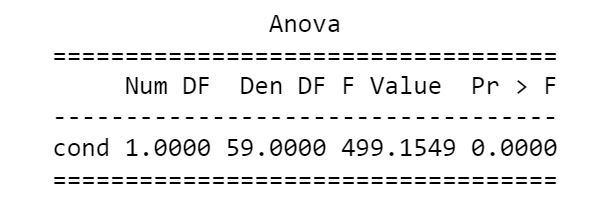
In the Statsmodels ANOVA example below we use our dataframe object, df, as the first argument, followed by our independent variable (‘rt’), subject identifier (‘Sub_id’), and the list of the dependend variable, ‘cond’. In the second row we are getting the fit so that we can print the ANOVA table.
在下面的Statsmodels ANOVA示例中,我们使用数据框对象df作为第一个参数,然后使用自变量('rt'),主题标识符('Sub_id')和因变量(cond)列表。 在第二行中,我们可以进行拟合,以便可以打印ANOVA表。
aovrm = AnovaRM(df, 'rt', 'Sub_id', within=['cond'])
res = aovrm.fit()

print(res)
In the second example we will also use the parameter aggregate_func. Click here to download the dataset.
在第二个示例中,我们还将使用参数aggregate_func。 单击此处下载数据集。
flanks = pd.read_csv('flanks.csv')
res = AnovaRM(flanks, 'RT', 'SubID', within=['TrialType'], aggregate_func='mean')

print(res.fit())
使用Statsmodels进行重复测量的双向方差分析 (Two-way ANOVA for Repeated Measures Using Statsmodels)
Finally, we continue with the two-way ANOVA. In the example below we are also using Pandas and the AnovaRM class from statsmodels. The example data can be downloaded here.
最后,我们继续进行双向方差分析。 在下面的示例中,我们还使用了statsmodels中的Pandas和AnovaRM类。 示例数据可在此处下载。
使用Statsmodels的双向ANOVA示例: (Two-Way ANOVA Using Statsmodels Example:)
Notice the difference between the one-way ANOVA and the two-way ANOVA; the list now contains 2 variables.
注意单向方差分析和双向方差分析之间的区别; 该列表现在包含2个变量。
df2way = pd.read_csv('rmAOV2way.csv')
aovrm2way = AnovaRM(df2way, 'rt', 'Sub_id', within=['iv1', 'iv2'])
res2way = aovrm2way.fit()

print(res2way)
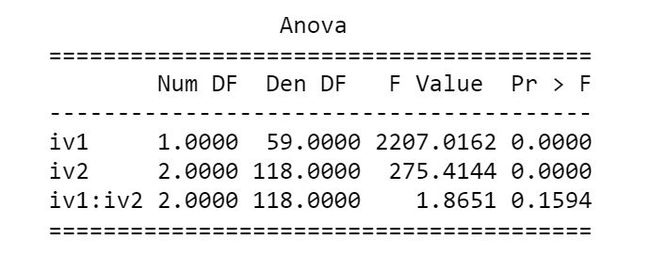
The ANOVA table when carrying out a two-way ANOVA using Statsmodels look like this:
使用Statsmodels执行双向ANOVA时的ANOVA表如下所示:
- Four Ways to Conduct One-Way ANOVA with Python
- Three Ways to do a Two-Way ANOVA with Python
- 用Python进行单向方差分析的四种方法
- 使用Python进行双向ANOVA的三种方法
重复测量方差分析:R与Python (Repeated Measures ANOVA: R vs. Python)
Finally, here’s the YouTube video covering how to carry out repeated measures ANOVA using Python and R. It will further show some of the differences between the function aov_ez and AnovaRM. Hint, there are more arguments available in aov_ez and it will calculate effect sizes, among other things.
最后,这是YouTube视频,内容涉及如何使用Python和R进行重复测量ANOVA。它将进一步显示aov_ez函数和AnovaRM函数之间的一些区别。 提示,aov_ez中有更多可用参数,除其他功能外,它将计算效果大小。
That was it, now you know how to carry out one-way and two-way ANOVA for repeated measures using Python Statsmodels.
就是这样,现在您知道如何使用Python Statsmodels对重复测量执行单向和双向方差分析。
翻译自: https://www.pybloggers.com/2018/10/repeated-measures-anova-in-python-using-statsmodels/