coursera-斯坦福-机器学习-吴恩达-第2周笔记
coursera-斯坦福-机器学习-吴恩达-第2周笔记
目录:
文章目录
- coursera-斯坦福-机器学习-吴恩达-第2周笔记
- 1 多元线性回归
- 1.1 方程
- 1.2 损失函数 与 梯度下降
- 1.3 特征约简
- 1.4 小点:多项式回归
- 2 正规方程
- 2.1 正规方程 与 梯度下降 的优缺点
- 3 octave基础教程
- 3.1 下载安装octave
- 3.2 基本操作
- 3.3 向量操作
- 3.4 画图
- 4 编程作业-octave实现线性回归
- 4.1 作业环境
- 4.2 答案与分析
1 多元线性回归
1.1 方程
多元线性回归指的就是有多个X的情况。比如与房价y有关的变量有:房屋面积x1;位置x2
。
此时,我们就要把我们的方程
h θ ( x ) = θ 0 + θ 1 ∗ x h_\theta(x) = \theta_0 + \theta_1*x hθ(x)=θ0+θ1∗x
修改为:
h θ ( x ) = θ 0 + θ 1 x 1 + θ 2 x 2 + ⋯ + θ n x n h_\theta(x) = \theta_0 + \theta_1x_1 + \theta_2x_2 + \cdots + \theta_nx_n hθ(x)=θ0+θ1x1+θ2x2+⋯+θnxn
其实本质并没有变,就是变量x多了,所以参数θ也跟着多了。但是思想还是没有变:通过误差函数,经过梯度下降求参数。
为了结构统一,我们设 x0=1 ;此时方程应为:
h θ ( x ) = θ 0 + θ 1 x 1 + θ 2 x 2 + ⋯ + θ n x n = θ T x h_\theta(x) = \theta_0 + \theta_1x_1 + \theta_2x_2 + \cdots + \theta_nx_n = \theta^Tx hθ(x)=θ0+θ1x1+θ2x2+⋯+θnxn=θTx
如此一来,便将变量向量化了。也变得和第一章的一样了。
1.2 损失函数 与 梯度下降
同理,我们写出损失函数。
J ( θ 0 , θ 1 , . . . , θ n ) = 1 2 m ∑ i = 1 m ( h θ ( x i ) − y i ) 2 J(\theta_0, \theta_1,..., \theta_n) = \dfrac {1}{2m} \displaystyle \sum _{i=1}^m \left (h_\theta (x_{i}) - y_{i} \right)^2 J(θ0,θ1,...,θn)=2m1i=1∑m(hθ(xi)−yi)2
梯度下降的方法也没有变,重复往相减即可。
repeat until convergence:{
θ j = θ j − α ∂ ∂ θ j J ( θ ) = θ j − α 1 m ∑ i = 1 m ( h θ ( x ( i ) ) − y ( i ) ) ∗ x j ( i ) \theta_j = \theta_j - \alpha\frac{\partial}{\partial\theta_j}J(\theta) = \theta_j - \alpha\frac{1}{m}\sum_{i=1}^{m}(h_\theta(x^{(i)}) - y^{(i)})*x_j^{(i)} θj=θj−α∂θj∂J(θ)=θj−αm1∑i=1m(hθ(x(i))−y(i))∗xj(i)
}
其中α的选择有讲究:
如果α太小,则收敛速度慢。
如果α太大:每次迭代都不会减少,因此可能不会收敛。
1.3 特征约简
当两种变量数值维度相差过大的时候,梯度下降法会迭代得很慢,比如房屋面积X1都是100多平米,楼层都是1、2、3这样的数字,两种特征就相差很大。
在这种情况下,
我们可以通过使每个输入值在大致相同的范围内来加速梯度下降。(−1 ≤ x(i) ≤ 1)
课程介绍了两种方式:1.特征缩放2.均值归一化
-
特征缩放
就是将数字除以最大的数,比如100 -
均值归一化 平均归一化包括从该输入变量的值中减去输入变量的平均值,导致输入变量的新平均值为零。
公式:
x i : = x i − μ i s i x_i := \dfrac{x_i - \mu_i}{s_i} xi:=sixi−μi
其中μi是特征(i)的所有值的平均值,si是值的范围(max - min),或者si是标准偏差。
例如,如果xi代表100到2000的平均值和1000的房价,那么,每个价格都转化为:
x i : = p r i c e − 1000 1900 x_i := \dfrac{price-1000}{1900} xi:=1900price−1000
1.4 小点:多项式回归
有些时候,直线并不能很好的拟合数据。有些时候各种曲线反而更好。比如:
![]()
在这种时候,
除了线性回归外(图像是直线),我们也能采用多项式回归 (图像是曲线)。我们的解决办法是设变量:
举例如下假设函数:
h θ ( x ) = θ 0 + θ 1 x + θ 2 x 2 + θ 3 x 3 h_\theta(x) = \theta_0 + \theta_1x + \theta_2x^2 + \theta_3x^3 hθ(x)=θ0+θ1x+θ2x2+θ3x3
我们的技巧是 设: x2 and x3 并且使
$x_2 = x_1^2 $
x 3 = x 1 3 x_3 = x_1^3 x3=x13
这样原式子就变成:
$h_\theta(x) = \theta_0 + \theta_1x_1 + \theta_2x_1^2 + \theta_3x_1^3= \theta_0 + \theta_1x_1 + \theta_2x_2 + \theta_3x_3 $
这样就把多项式回归,转化成了多参数线性回归。可方便计算。
2 正规方程
除了梯度下降法,另一种求最小值的方式则是让代价函数导数为0,求θ值 。即:
- 写出代价函数:
J ( θ ) = 1 2 m ∑ i = 1 m ( h θ ( x ( i ) ) − y ( i ) ) 2 J(\theta) = \frac{1}{2m}\sum_{i=1}^{m}(h_\theta(x^{(i)}) - y^{(i)})^2 J(θ)=2m1∑i=1m(hθ(x(i))−y(i))2 - 求导,并令其等于零:
∂ ∂ θ j J ( θ ) = 0 \frac{\partial}{\partial\theta_j}J(\theta) = 0 ∂θj∂J(θ)=0
3. 解得:
θ = ( X T X ) − 1 X T y \theta = (X^TX)^{-1}X^Ty θ=(XTX)−1XTy
2.1 正规方程 与 梯度下降 的优缺点
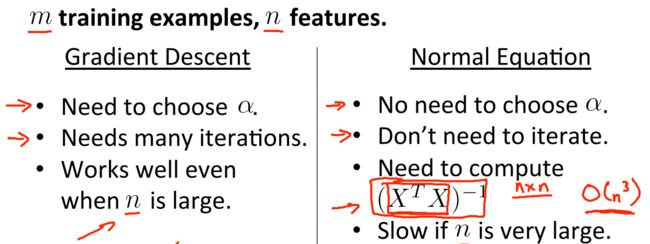
- 梯度下降要设置α并不保证一次能获得最优的α,正规方程不用考虑α。
- 梯度下降要迭代多次,正规方程不用。(所以,遇到比较简单的情况,可用正规方程)
- 梯度下降最后总能得到一个最优结果,正规方程不一定。因为正规方程要求X的转置乘X的结果可逆。
- 当特征数量很多的时候,正规方程计算不方便,不如梯度下降。
总体来说:
- 正规方程计算巧妙,但不一定有效。
- 梯度下降法速度慢,但是稳定可靠。
3 octave基础教程
3.1 下载安装octave
打开 octave官方网站 ,下载windows 64W版本。新手不要使用ZIP下载,比较难配置。j建议直接下载EXE 下一步下一步安装即可。
打开程序界面如下:

界面交互非常友好,左面是文件夹,可以直接修改工作文件件,右面是控制台可以输入指令。
3.2 基本操作
Octave最简单的使用方式就是像使用一个计算器一样在命令提示符下输入相应的计算式。Octave能识别通常的计算表达式。例如,在终端输入
2+2
并按回车键,你将得到以下的结果
ans=4
各种计算符号的优先级与常规的一致,比如括号有最大优先级,其次为乘方,其次为乘、除运算,最后为加、减运算。
Octave还提供了一系列的常用数学函数,其中的一部分函数如表1所示:

3.3 向量操作
构造向量:
1. a=[1 4 5];

2. d=[a 6];
向量构造函数:
1. zeros(M,N) 创建一个M×N的零矩阵

2. ones(M,N) 创建一个M×N的全1矩阵

3. linspace(x1,x2,N) 创建一个N个元素的向量,均匀分布于x1和x2之间

4.rand() 生成随机数矩阵
向量计算
1. 遵循向量+、-、*、/

2. 两个向量的相乘遵循矩阵的乘法法则,向量乘法并不是对应元素的相乘。如果要两个向量的进行对应元素的乘除法, 你可以使用.*或者./算符

3. ^ 为乘方计算

4.转置 X‘
3.4 画图
最基本的画图命令是plot(x,y),其中x,y分别为横轴和纵轴数据,
举例如下:
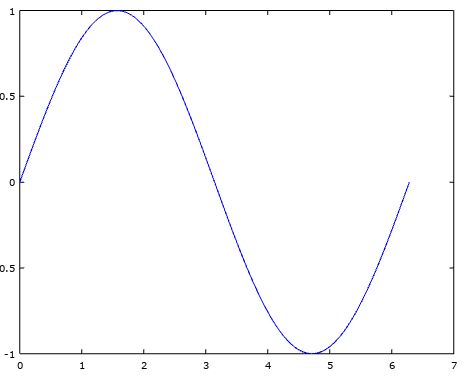
angles=linspace(0,2*pi,100),y=sin(angles), 则plot(angles,y)图像如下:

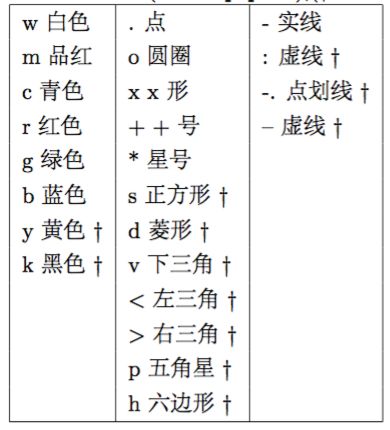
图形形状可以修改,这一点与python的matplotlib很像,比如plot(angles,y,‘ro’)图像如下:

title(‘Graph of y=sin(x)’),xlabel(‘Angle’),ylabel(‘Value’)进行标题,横轴,纵轴的表示。
replot命令来更新图片,grid命令为图片添加网格线。
legend命令为该图片在右上角添加相应的图例legend(‘Sine’,‘Cosine’),图像如下:

另外:
1. 多幅图片可以通过figure命令来控制。figure命令下一个plot命令将会在新创建的窗口中绘制,figure(1)返回上一张图片

2. 保存当前图像到一个eps文件 print('graph1.eps','-deps')
4 编程作业-octave实现线性回归
4.1 作业环境
- 下载 作业包
在此下载第一次编程任务。
此ZIP文件包含PDF的说明。注意PDF是最好的说明说,里面详细的说明了每一步操作,和下一步操作,对照着谷歌翻译,一步步走即可。
要做作业,用cd命令,进入作业文件夹。
- 介绍一下里面的文件:
- 主文件ex1.m,他是整个任务的流程文件 他自动调用其他文件,运行他可以一步步走完每个小人任务。
- computeCost.m 计算代价函数的 文件。我们要在里面填空。填空完成,再次运行ex1.m 即可。
- gradientDescent.m :计算梯度下降的文件,我们要在里面填空。填空完成,再次运行ex1.m 即可使用我们自己的梯度下降算法。
最后提交文件:使用octave在当前作业文件件内输入submit() 然后输入自己的邮箱密码。
4.2 答案与分析
这个作业的主文件是ex1.m,它控制着整个流程,让作业程序 一步一步往下走,但是我们并不需要修改这个文件,只需要把它调用的代码文件 挨个修改即可。
- Part 1
首先我们来看 第一个小作业,ex1.m中的作业要求如下:
%% ==================== Part 1: Basic Function ====================
% Complete warmUpExercise.m
fprintf('Running warmUpExercise ... \n');
fprintf('5x5 Identity Matrix: \n');
warmUpExercise()

fprintf('Program paused. Press enter to continue.\n');
pause;
意思就是,通过修改warmUpExercise.m这个文件,让主程序调用它时能产生一个5*5的矩阵。那么我们就去修改这个文件,在文件包里找到这个文件,然后在原来代码的基础上添加一句话即可:
A = eye(5); # 生成一个5*5的矩阵
总样子为:
function A = warmUpExercise()
%WARMUPEXERCISE Example function in octave
%   A = WARMUPEXERCISE() is an example function that returns the 5x5 identity matrix

A = [];
% ============= YOUR CODE HERE ==============
% Instructions: Return the 5x5 identity matrix
%               In octave, we return values by defining which variables
%               represent the return values (at the top of the file)
%               and then set them accordingly.


A = eye(5);

% ===========================================


end
- part 2
作业要求:
%% ======================= Part 2: Plotting =======================
fprintf('Plotting Data ...\n')
data = load('ex1data1.txt');
X = data(:, 1); y = data(:, 2);
m = length(y); % number of training examples

% Plot Data
% Note: You have to complete the code in plotData.m
plotData(X, y);

fprintf('Program paused. Press enter to continue.\n');
pause;
这一步,已经帮你装载好了数据ex1data1.txt,并分配为了x,y。你要完成画图函数plotData.m,把这个数据画出来。
同理修改plotData.m为:
function plotData(x, y)
%PLOTDATA Plots the data points x and y into a new figure
%   PLOTDATA(x,y) plots the data points and gives the figure axes labels of
%   population and profit.

figure; % open a new figure window

% ====================== YOUR CODE HERE ======================
% Instructions: Plot the training data into a figure using the
%               "figure" and "plot" commands. Set the axes labels using
%               the "xlabel" and "ylabel" commands. Assume the
%               population and revenue data have been passed in
%               as the x and y arguments of this function.
%
% Hint: You can use the 'rx' option with plot to have the markers
%       appear as red crosses. Furthermore, you can make the
%       markers larger by using plot(..., 'rx', 'MarkerSize', 10);
plot(x, y, 'rx', 'MarkerSize', 10); % Plot the data
ylabel('Profit in $10,000s'); % Set the y?axis label
xlabel('Population of City in 10,000s'); % Set the x?axis label

% ============================================================

end
- part 3
要求
就是完成梯度下降函数computeCost.m:
function J = computeCost(X, y, theta)
%COMPUTECOST Compute cost for linear regression
%   J = COMPUTECOST(X, y, theta) computes the cost of using theta as the
%   parameter for linear regression to fit the data points in X and y

% Initialize some useful values
m = length(y); % number of training examples

% You need to return the following variables correctly
J = 0;

% ====================== YOUR CODE HERE ======================
% Instructions: Compute the cost of a particular choice of theta
%               You should set J to the cost.
h = X*theta - y;
J = 1/(2*m) * sum(h.^2);

% =========================================================================

end
其实重点就两句话:
h = X * theta;
J = 1/(2*m) * sum((h-y).^2);
这是根据前面一章的基础知识来写的,一定要注意复习,知道为什么公式这么写。
- part4
修改梯度下降函数gradientDescent.m,添加代码
theta = theta - alpha/m*X'*(X*theta - y);
最后的结果
function [theta, J_history] = gradientDescent(X, y, theta, alpha, num_iters)
%GRADIENTDESCENT Performs gradient descent to learn theta
%   theta = GRADIENTDESCENT(X, y, theta, alpha, num_iters) updates theta by
%   taking num_iters gradient steps with learning rate alpha

% Initialize some useful values
m = length(y); % number of training examples
J_history = zeros(num_iters, 1);

for iter = 1:num_iters

    % ====================== YOUR CODE HERE ======================
    % Instructions: Perform a single gradient step on the parameter vector
    %               theta.
    %
    % Hint: While debugging, it can be useful to print out the values
    %       of the cost function (computeCost) and gradient here.
    %

    theta = theta - alpha/m*X'*(X*theta - y);

    % ============================================================

    % Save the cost J in every iteration
    J_history(iter) = computeCost(X, y, theta);

end

end
画出图片:


