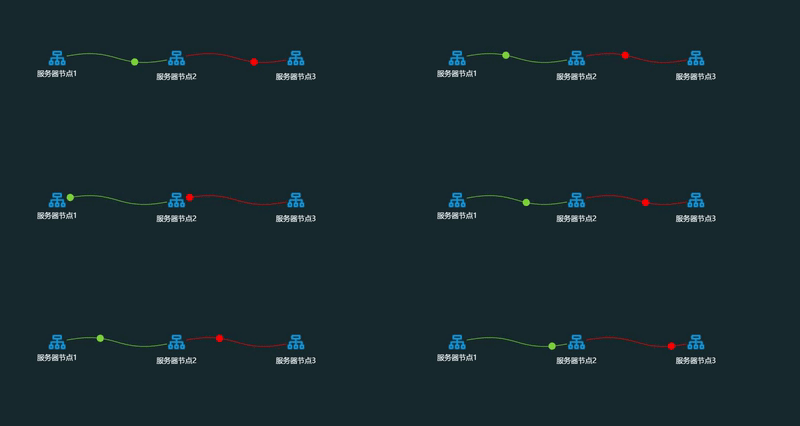
项目中使用antv G6 实现节点链路之间动态效果
项目前端开发框架是使用VUE
项目需求:在不同的服务节点之间,根据不同的链路数据,显示出节点之间的链路状态,同时实现节点之间的动态效果。
先看效果
1 下载依赖包
# 使用CND引入
npm i @antv/g
2 引入项目使用
在main.js中添加
import G6 from '@antv/g6'
Vue.prototype.$G6 = G6;
3 开发使用
先定义数据,数据是一个对象类型,主要包含nodes和edges。整个数据如下:
{
      nodes: [
        {
          id: 'node1', //节点id,不能重复
          img:'../../static/images/third/node.png', //这里可以自定义节点的小图标
          x: 100, //节点水平方向坐标
          y: 100, //节点竖直方向坐标
          label: '服务器节点1', //节点标签
          labelCfg: { //节点标签的样式
            position: 'bottom',
            style: {
              fill: '#ffffff',
              fontSize: 12,
            },
          },
        },
        {
          id: 'node2',
          img:'../../static/images/third/node.png',
          x: 300,
          y: 100,
          color: '#40a9ff',
          label: '服务器节点2',
          labelCfg: {
            position: 'bottom',
            offset: 10,
            style: {
              fill: '#ffffff',
              fontSize: 12,
            },
          },
        },
        {
          id: 'node3',
          img:'../../static/images/third/node.png',
          x: 500,
          y: 100,
          color: '#40a9ff',
          label: '服务器节点3',
          labelCfg: {
            position: 'bottom',
            offset: 10,
            style: {
              fill: '#ffffff',
              fontSize: 12,
            },
          },
        },
      ],
      edges: [//节点之间的连线
        {
          source: 'node1', //起始节点
          target: 'node2', //终止节点
          style: {
            stroke: '#7CD13B', //节点之间连线的样式
          },
        },
        {
          source: 'node2',
          target: 'node3',
          style: {
            stroke: '#FF0000',
          },
        },
      ],
    };
将数据渲染到容器(div)里面
      //获取容器宽高
      let width = document.getElementById('lineChart').scrollWidth;
      let height = document.getElementById('lineChart').scrollHeight;
      //初始化图表
      this.graph = new this.$G6.Graph({
        container: 'lineChart', //div容器的id
        width,
        height,
        defaultNode: {
          type: 'image', //节点类型
          size: [32, 32], //节点大小
          style: {
            fill: '#DEE9FF',
            stroke: '#5B8FF9',
          },
        },
        defaultEdge: {
          type: 'circle-running', //节点之间连线类型
          style: { //节点之间连线的样式
            lineWidth: 2,
            stroke: '#bae7ff',
          },
        },
      });
      this.graph.data(data); //将数据添加到初始化后的图表对象中
      this.graph.render(); //渲染图表
至此,可将节点渲染在div中,那么如何实现节点连线上的小圆圈的动态效果呢,这就用到了registerEdge函数,实现方法如下。
  	  //registerEdge函数会遍历每一个节点
      //下面这两个参数是为了设置连线上圆圈的不同颜色
      let edgeCircleColorIndex = 0;
      let edgeCircleColorArr = ["#7CD13B", "#FF0000"];

      this.$G6.registerEdge(
        'circle-running',
        {
          afterDraw(cfg, group) {
            const shape = group.get('children')[0];
            const startPoint = shape.getPoint(0);
            //创建节点之间的圆圈,并为每一个设置样式
            const circle = group.addShape('circle', {
              attrs: {
                x: startPoint.x,
                y: startPoint.y,
                fill: edgeCircleColorArr[edgeCircleColorIndex++],
                r: 6, //圆圈大小
              },
              name: 'circle-shape',
            });


            // 实现动态效果
            circle.animate(
              ratio => {
                const tmpPoint = shape.getPoint(ratio);
                return {
                  x: tmpPoint.x,
                  y: tmpPoint.y,

                };
              },
              {
                repeat: true, //动画是否重复
                duration: 3000, //一次动画持续时长
              },
            );
          },
        },
        'cubic',
      );
当数据变化时,重新渲染即可
      this.graph.data(data);
      this.graph.render();
