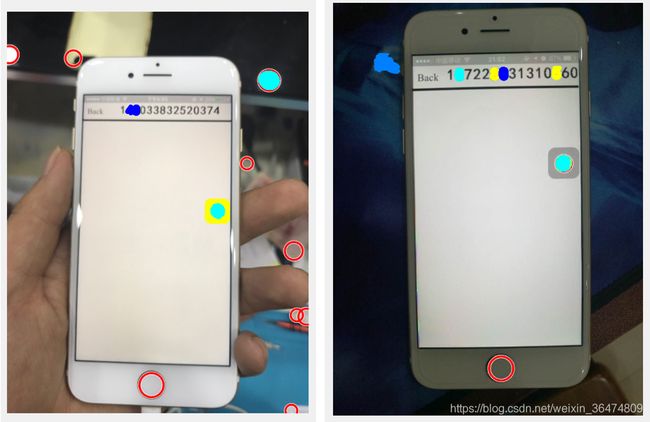
2016.12手机屏幕悬浮点检测
代码地址:https://github.com/Xingxiangrui/circle_detect_on_phone_screen
目录
辅点检测程序说明
一、MSER算法
'RegionAreaRange',[600 3000]
'ThresholdDelta'
Eccentricity偏心率
二、霍夫变换找圆形区域
代码
辅点检测程序说明
辅点检测程序主要分两个主要部分:
- MSER区域提取
- 霍夫变换找圆形区域
辅点区域为用这两个算法的检测到的结果区域进行叠加
一、MSER算法
MSER = Maximally Stable Extremal Regions
目前业界认为是性能最好的仿射不变区域,MSER是当使用不同的灰度阈值对图像进行二值化时得到的最稳定的区域,特点:
1.对于图像灰度的仿射变化具有不变性
2.稳定性,区域的支持集相对灰度变化稳定
3.可以检测不同精细程度的区域
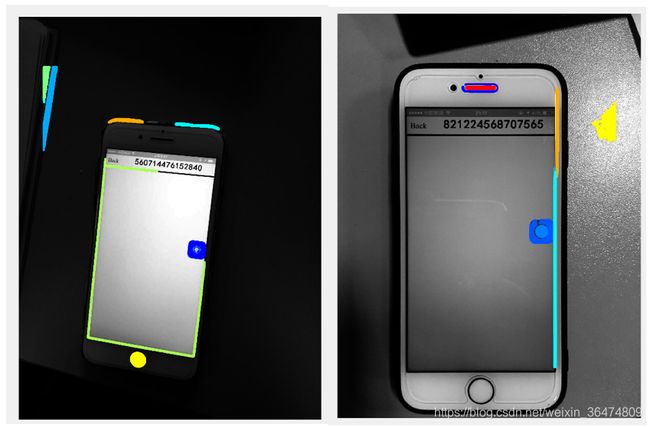
如下图:不同色彩的区域即为MSER探测出的灰度较为连续的区域。
在MSER算法运用到辅点的探测中时,运用辅点区域的特性对两个参数进行设置
'RegionAreaRange',[600 3000]
区域的大小。经过测量,辅点区域的大小取值范围在[600 3000]之间
此参数可以避免探测到过大或者过小的区域。
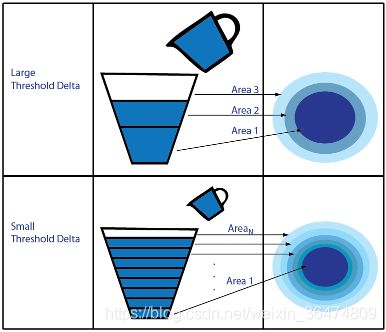
'ThresholdDelta'
此值表示不同区域间灰度的差值,此值越小则算法探测到的区域数目越多。为了避免漏检情况,程序设置了四个'ThresholdDelta'值,分别为0.1,0.8,1.4,2.5,使各种对比度下辅点区域都能被探测到。
仅用上面两种参数可以探测出区域面积范围在600到3000的区域
下图为运用这两个参数探测到的结果
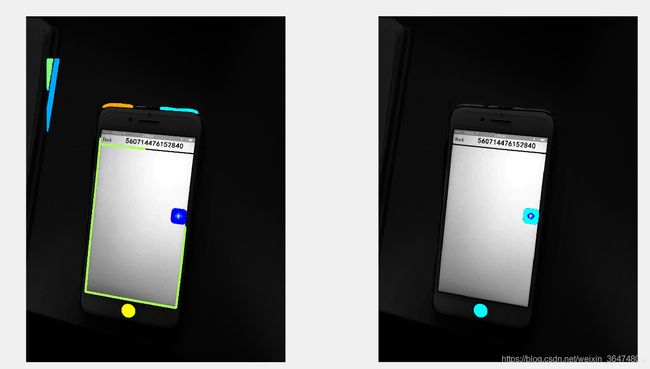
为了找出辅点区域,需要进一步进行筛选,辅点区域为圆形或方形区域,有着小的偏心率
Eccentricity偏心率
辅点区域的偏心率多小于0.8,运用这一参数就能把偏心率过大的区域滤掉。如下图,左为探测到区域,右为其中偏心率小于0.8的区域
二、霍夫变换找圆形区域
MSER可以探测到灰度值相近的区域,但是当辅点左右差值过大的时候,或者辅点与背景对比度过小的时候,MSER算法检出率不高,注意到辅点中心与外围之间是圆形的,可以借助霍夫变换找出边缘,进而找出圆形区域。
运用霍夫变换找出边缘,然后在边缘中找出半径在14到40之间的圆形,
- 'ObjectPolarity','bright'辅点区域周围较暗,中间较亮,故检测背景较暗,中间较亮的圆形区域。
- 'Sensitivity',0.85,此值越大,算法越敏感,会把像圆的 区域检测出来,返回更多的圆。此值较小时候,算法会比较严格需要很圆的区域。
- 'EdgeThreshold',0.02,表示检测到边缘时的灰度差值,此值小的时候会把相邻像素点之间更小的差值当作边缘来看,因为辅点区域圆边缘与周围差值较小,所以此值应设较小。
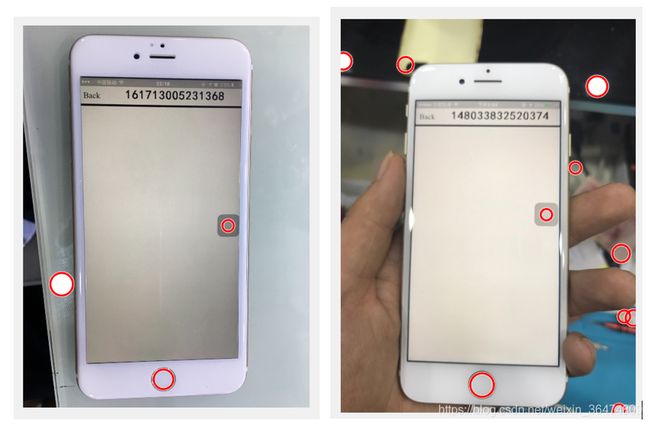
红色圈出即为检测到的圆。
两个算法结合可以提升检出率
附:
1.Matlab霍夫变换找圆程序说明:
http://cn.mathworks.com/help/images/ref/imfindcircles.html#outputarg_metric
2.MSER区域探测程序说明:
http://cn.mathworks.com/help/vision/ref/detectmserfeatures.html
代码
clear all;close all;clc;

%% use circle find
%Read the image into the workspace.
A = imread('t (6).jpg');

%Find all the circles with radius R
Rmin=10;Rmax=50;
Imagesize=size(A);
ROI=[80,160,Imagesize(2)-160,Imagesize(1)-320];
[centers, radii, metric] = imfindcircles(A,[15 40],...
    'ObjectPolarity','bright','Sensitivity',0.85,...
    'EdgeThreshold',0.02);

%Draw the circle perimeters.
figure
imshow(A);
viscircles(centers, radii,'EdgeColor','b');
hold on;

%% use MSER region
% Region Detection
%ROI region
I = rgb2gray(A);
Imagesize=size(I);
ROI=[80,160,Imagesize(2)-160,Imagesize(1)-320];

%Detect MSER regions.
[regions,mserCC] = detectMSERFeatures(I,'RegionAreaRange',[600 3000],...
    'ThresholdDelta',0.1,'ROI',ROI);
[regions1,mserCC1] = detectMSERFeatures(I,'RegionAreaRange',[600 3000],...
    'ThresholdDelta',0.8,'ROI',ROI);
[regions2,mserCC2] = detectMSERFeatures(I,'RegionAreaRange',[600 3000],...
    'ThresholdDelta',1.4,'ROI',ROI);
[regions3,mserCC3] = detectMSERFeatures(I,'RegionAreaRange',[600 3000],...
    'ThresholdDelta',2.5,'ROI',ROI);

% Measure the MSER region eccentricity to gauge region circularity.
stats = regionprops('table',mserCC,'Eccentricity');
stats1 = regionprops('table',mserCC1,'Eccentricity');
stats2 = regionprops('table',mserCC2,'Eccentricity');
stats3 = regionprops('table',mserCC3,'Eccentricity');

%Threshold eccentricity values to only keep the circular regions.
%(Circular regions have low eccentricity.)
eccentricityIdx = stats.Eccentricity < 0.8;
circularRegions = regions(eccentricityIdx);
eccentricityIdx1 = stats1.Eccentricity < 0.8;
circularRegions1 = regions1(eccentricityIdx1);
eccentricityIdx2 = stats2.Eccentricity < 0.8;
circularRegions2 = regions2(eccentricityIdx2);
eccentricityIdx3 = stats3.Eccentricity < 0.8;
circularRegions3 = regions3(eccentricityIdx3);

%Show the circular regions.
plot(circularRegions,'showPixelList',true,'showEllipses',false)
plot(circularRegions1,'showPixelList',true,'showEllipses',false)
plot(circularRegions2,'showPixelList',true,'showEllipses',false)
plot(circularRegions3,'showPixelList',true,'showEllipses',false)

