小项目-数据处理篇:真·租房信息整理,应用dash整合到地图上
接上一章内容:
经过了一下午的爬取,也算是终于搞到一份还算像样的数据:

经过去重还有8w3,可以玩耍了,重复原因有可能是因为,很多房源本身就发了很多回,就这8w3的数据应该也有重复,我们把title删除,再drop_duplicates一下:

还有7w多,这样的数据就比较真实了,数据到手,搞起:
df["rent"] = df["rent"].apply(lambda x: x[:-3]).astype("float32").astype("int32")
df["floor_area"] = df["floor_area"].astype("int32")
df["floor"] = df["floor"].apply(lambda x: x[:2])
df.head()
获取面积和租金:
新建一个参数,mean_rent 每平方米的租金:
df["mean_rent"] = (df["rent"]/df["floor_area"]).astype("int32")
df.sort_values("mean_rent")
获取mean_rent range 为(20,200):
df2 = df[df.mean_rent>20]
df2 = df2[df2.mean_rent<200]
df2.head()
然后在去掉大于400平米的房源:
df2 = df2[df2.floor_area < 400]再对装修情况进行处理:
def change_decoration(x):
    if x==" ":
        x="暂无资料"
    elif x == "中等装修":
        x = "中装修"
    elif x=="简单装修":
        x = "简装修"
    else:
        pass
    return x
df2["decoration"] = df2["decoration"].apply(change_decoration)
df2.head()
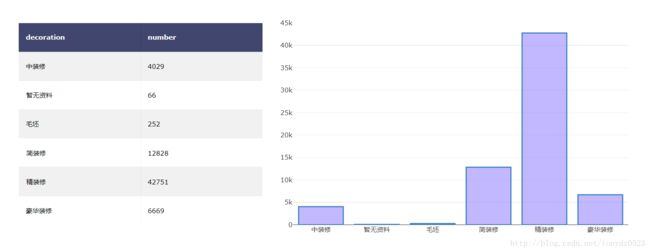
获取不同装修情况的房源数量看一下:
decoration = df2.groupby("decoration").count().iloc[1:,[0]].rename(columns={"area":"number"}).reset_index()
import plotly
import plotly.plotly as py
import plotly.graph_objs as go
import plotly.figure_factory as ff
figure = ff.create_table(decoration, height_constant=60)
trace1 = go.Bar(
    x=decoration.decoration,
    y=decoration.number,
    text=decoration.number,
    textposition = 'auto',
    xaxis='x2',
    yaxis='y2',
    marker=dict(
        color='rgba(132, 112, 255 ,0.5)',
        line=dict(
            color='rgba(55, 128, 191, 1.0)',
            width=2,
        )
    )
)
figure['data'].extend(go.Data([trace1]))
figure.layout.xaxis.update({'domain': [0, .4]})
figure.layout.xaxis2.update({'domain': [0.45, 1.]})
figure.layout.yaxis2.update({'anchor': 'x2'})
figure.layout.xaxis2.update({'anchor': 'y2'})
# figure.layout.update({'height':500})
figure.layout.margin.update({'t':50, 'b':50,'l':200,'r':200})

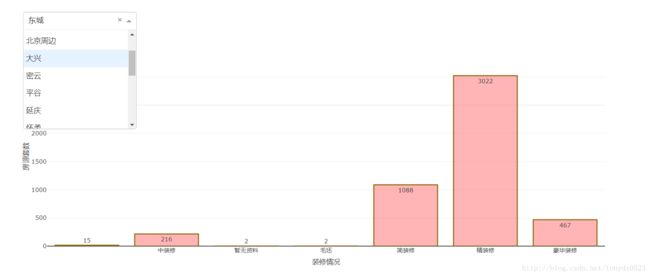
plotly.offline.plot(figure,filename='table&bar')应用dash制作可选择区域的装修情况:
上代码:
#根据区域创建group
dff = df2.loc[:,["area","decoration"]]
grouped = dff.groupby("area")

import dash
import dash_core_components as dcc
import dash_html_components as html
import plotly.graph_objs as go
import pandas as pd

app = dash.Dash()
#获取全部区域名字
names= []
for name,_ in grouped:
    names.append(name)

app.layout = html.Div([
    html.Div([
        html.Br(),
        html.Div([
        #创建下拉框
            dcc.Dropdown(
                id='area',
                options=[{'label': i, 'value': i} for i in names],
                value=names[0]
            ),
        html.Br(),
        ],
       #下拉框位置
    style={'width': '15%','margin-left': '10%' ,'display': 'inline-block'}),
    #传参数
    dcc.Graph(id='indicator-graphic')
    ])
])

@app.callback(
    dash.dependencies.Output('indicator-graphic', 'figure'),
    [dash.dependencies.Input('area', 'value')])

def update_graph(value):

    group = grouped.get_group(value)
    dfx = group.groupby("decoration").count().reset_index().sort_values("decoration")
    return {
        'data': [go.Bar(
    x=dfx.decoration,
    y=dfx.area,
    text=dfx.area,
    textposition = 'auto',
    marker=dict(
        color='rgba(255 ,106, 106 ,0.5)',
        line=dict(
            color='rgba(139, 101, 8, 1.0)',
            width=2,
        )
    )
)],
    'layout': go.Layout(
        xaxis={
            'title': "装修情况"
        },
        yaxis={
            'title': "房源套数"
        },
        margin={'l': 200, 'b': 40, 't': 50, 'r': 200},
        hovermode='closest'
        )
    }
app.css.append_css({
    "external_url": "https://codepen.io/chriddyp/pen/bWLwgP.css"
})

if __name__ == '__main__':
    app.run_server()
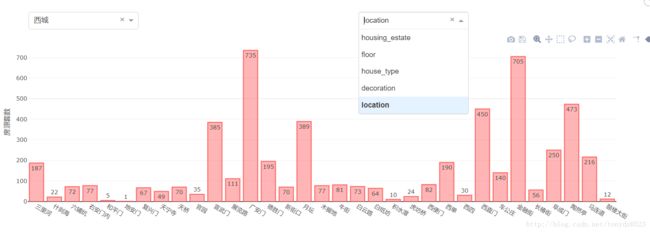
通过更改 decoration为 housing_estate,就可以显示各区域小区情况:

于是我稍加修改,添加一个下拉选项,就可以显示更多信息了:
xiaoqu = db["xiao"]
dfm = pd.DataFrame(list(xiaoqu.find()))
del dfm["_id"]
del dfm["num"]
dfm = dfm.dropna()
根据小区合并数据:
dft = pd.merge(df2,dfi,left_on="housing_estate",right_index = True).drop_duplicates()
dft = dft.dropna()
dft["lat"] = dft["lat"].astype("float32")
dft["lon"] = dft["lon"].astype("float32")
dft.head()dft = dft.iloc[:,[0,5,8,9,10]]
dfc = dft.groupby("housing_estate").count().iloc[:,[0]].rename(columns={"area":"number"})
dfm = dft.groupby("housing_estate").mean()
dfx = pd.merge(dfc,dfm,left_index=True,right_index = True).reset_index()
dfa = dft.iloc[:,[0,1]].drop_duplicates()
dfa.head()获取区域,小区,坐标,数量,平均房价数据集:
然后是按区域groupby,做以提取数据的key值,作图:
grd = dfp.groupby("area")图像代码如下
import dash
from dash.dependencies import Input, Output
import dash_core_components as dcc
import dash_html_components as html
from plotly import graph_objs as go
from plotly.graph_objs import *
import pandas as pd
import random

app =dash.Dash()

mapbox_access_token = '你的token'  #mapbox注册获取
colors = ["red","rgb(0,116,217)","rgb(255,65,54)","rgb(133,20,75)","rgb(255,133,27)","green","rgb(138 ,43, 226)","rgb(47 ,79 ,79)",
          "#26CC58", "#28C86D", "#29C481", "#2AC093", "#2BBCA4","#613099","#F4EC15", "#DAF017", "#BBEC19", "9DE81B"]
names= []

for name,_ in grd:
    names.append(name)

def get_figure(values):
    datas = []
    i = 0
    for value in values:
        dfx = grd.get_group(value)
        dfx['text'] = dfx['housing_estate'] + '
 ' + (dfx['number']).astype(str)+' 套房出租' + '
 ' +'每平每月房租'+ (dfx['mean_rent']).astype(int).astype(str)
        city = Data([Scattermapbox(
            lon=dfx['lon'],
            lat=dfx['lat'],
            mode='markers',
            marker=Marker(
                size=dfx["number"] * 3,
                color=colors[random.randint(0,16)],
                sizemode='area'
            ),
            text=dfx['text'],
            name = value
         )])
        i +=1
        datas.extend(city)
    layout = Layout(
        autosize=True,
        height=650,
        width=1250,
        margin=Margin(l=10, r=0, t=20, b=20),
        hovermode='closest',
        mapbox=dict(
            accesstoken=mapbox_access_token,
            bearing=0,
            center=dict(
                lat=39.908543,
                lon=116.397389
            ),
        pitch=0,
        zoom=10,
        style='mapbox://styles/mapbox/streets-v10'
        ),
    )
    return go.Figure(data=datas, layout=layout)

app.layout = html.Div([
    html.Div([
        html.Br(),
        html.Div([
            dcc.Dropdown(
                id='area',
                options=[{'label': i, 'value': i} for i in names],
                value= names, #[names[1],names[7]],
                multi=True
            ),

        ],style={'width': '70%','margin-left': '14%' ,'display': 'inline-block'},
    ),
    html.Br(),
    html.Div([
    dcc.Graph(id='indicator-graphic')
    ],style={'margin-left': '10%' ,'display': 'inline-block'}),

    ])
])

@app.callback(
    dash.dependencies.Output('indicator-graphic', 'figure'),
    [dash.dependencies.Input('area', 'value')])

def update_graph(value):
    return get_figure(value)

app.css.append_css({
    "external_url": "https://codepen.io/chriddyp/pen/bWLwgP.css"
})

if __name__ == '__main__':
    app.run_server()
运行之后效果图:
在这些数据中获取比较匹配自己的房源,对房租不要超过5500,的平均房租在60-100之间为条件筛选:
df3= df0[df0.rent<5500]
df3 = df3[df3.mean_rent >= 60]
df3 = df3[df3.mean_rent<= 100]
选取使用数据:
df4 = df3.iloc[:,[5,8,9,10]]
df4.tail()| housing_estate | mean_rent | lat | lon | |
|---|---|---|---|---|
| 70109 | 北洼西里 | 92 | 39.938511 | 116.298363 |
| 70111 | 北洼西里 | 90 | 39.938511 | 116.298363 |
| 70120 | 北洼西里 | 96 | 39.938511 | 116.298363 |
| 70125 | 北洼西里 | 81 | 39.938511 | 116.298363 |
| 70126 | 北洼西里 | 86 | 39.938511 | 116.298363 |
获取数量,均值,合并:
df5 = df4.groupby("housing_estate").count().iloc[:,[0]].rename(columns={"mean_rent":"number"})
df6 =  df4.groupby("housing_estate").mean().reset_index()
df7 = pd.merge(df6,df5,left_on = "housing_estate",right_index=True)
df7.head()| housing_estate | mean_rent | lat | lon | number | |
|---|---|---|---|---|---|
| 0 | 10AM新坐标 | 86.545455 | 39.867779 | 116.444382 | 11 |
| 1 | 11STATION | 72.000000 | 39.893749 | 116.418221 | 1 |
| 2 | 3G木兰公寓 | 80.250000 | 39.847763 | 116.433868 | 4 |
| 3 | 7克拉 | 87.500000 | 39.839588 | 116.386139 | 4 |
| 4 | 8哩岛 | 61.000000 | 39.937344 | 116.631310 | 1 |
存储数据:
df7.to_csv("house_1.0.csv",encoding="utf-8")之后就是将数据整合到工作信息的地图上:
这样就完成了可视化。
下一章要用这些数据做一些机器学习方面的小实验。


