本文用到的包
import Image
import urllib
import numpy as np
from cStringIO import StringIO
import matplotlib.pyplot as plt
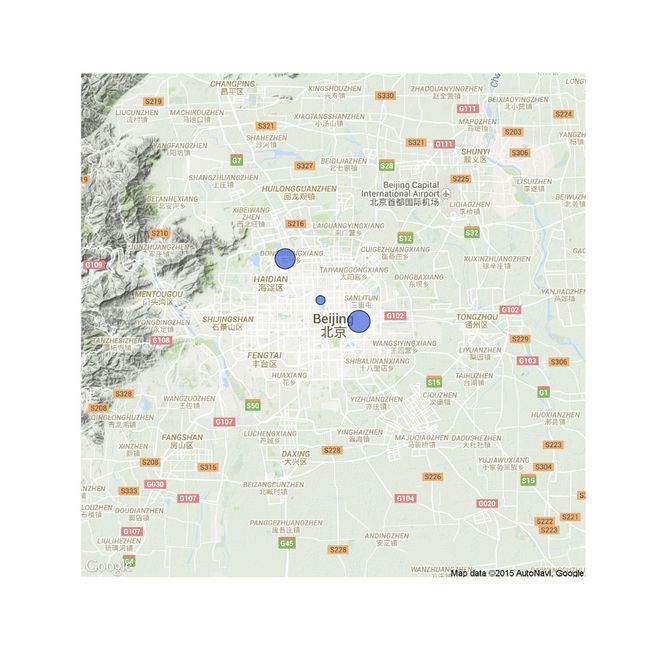
处理一些地理信息的时候,Google Map提供的API是一个很好的选择。例如下图展示了北京的三个位置某个变量的大小。
调用这个API的过程也很简单
def Gmap(centerLat,centerLon,zoomS,pixelS,size,dark,saveAddress):
    url = 'http://maps.googleapis.com/maps/api/staticmap?sensor=false'\
    +'&size='+str(size)+'x'+str(size)+'¢er='+str(centerLat)+','\
    +str(centerLon)+'&zoom='+str(zoomS)+'&scale='+str(pixelS)\
    +'&maptype=terrain'
    if dark==True:
        url = url+'&style=feature:all|element:all|saturation:-10|lightness:20'
    buffer = StringIO(urllib.urlopen(url).read())
    image = Image.open(buffer)
    if saveAddress:
        image.save(saveAddress)
    else:
        image.show()

def latLonToPixelXY(lat,lon,zoomS):
    mapW = 256*2**zoomS+0.0
    mapH = 256*2**zoomS+0.0
    x = (lon+180)*(mapW/360)# get x value
    latRad = lat*np.pi/180# convert from degrees to radians
    mercN = np.log(np.tan((np.pi/4)+(latRad/2)))# get y value
    y = (mapH/2)-(mapW*mercN/(2*np.pi))
    return x,y
第一个函数调用一张静态Google地图并存成图片格式,第二个函数将手头的地理信息数据的坐标转化,使得我们可以将之标示在第一张图的像素坐标系中。
在使用第一个函数时,我们需要先指定一些参数,例如
centerLat,centerLon = (39.90403,116.407526); scale = 10; pixelS = 2; size = 640
centerLat和centerLon顾名思义是地图中心点的维度和经度,scale是放大倍数,pixelS是像素分辨率,与size结合使用。对参数的说明可参考Google Map API官方介绍。
有了上述函数,我们可以使用如下代码先生存北京地图
Gmap(centerLat,centerLon,scale,pixelS,size,True,'/Users/csid/Desktop/beijing.png')
如果将代码改为
Gmap(centerLat,centerLon,scale,pixelS,size,True,'')
地图就会在当前代码编辑器(例如,IPython)中打开,而不是储存起来。
假设我们手头有数据
data={'40.081071_116.240201': 5,
      '39.970583_116.363472':1,
      '39.910411_116.222221':6}
可以以下列方式在刚刚储存的图片中绘制出来,并重新保存,得到图1。
#----------------prepare GIS data-------------
centX,centY = latLonToPixelXY(centerLat,centerLon,scale)
M={}
for x,y in data:
    w=data[(x,y)]
    lat,lon = map(float,x.split('_'))
    x,y = latLonToPixelXY(float(lat),float(lon),scale)
    x,y = size*pixelS/2 + x - centX,  size*pixelS/2 - (y - centY)
    M[(x,y)]=w
#-----------------plot---------------
fig = plt.figure(figsize=(10, 10))
im = np.flipud(plt.imread('/Users/csid/Desktop/beijing.png'))
ax = plt.subplot(111)
ax.imshow(im, origin='lower')
for x,y in M:
    ax.scatter(x,y,s=100*M[(x,y)],facecolor='RoyalBlue',lw=1,alpha=0.7)
ax.set_xlim(0,size*pixelS)
ax.set_ylim(0,size*pixelS)
plt.axis('off')
#plt.show()
plt.savefig('/Users/csid/Desktop/beijingDots.png')
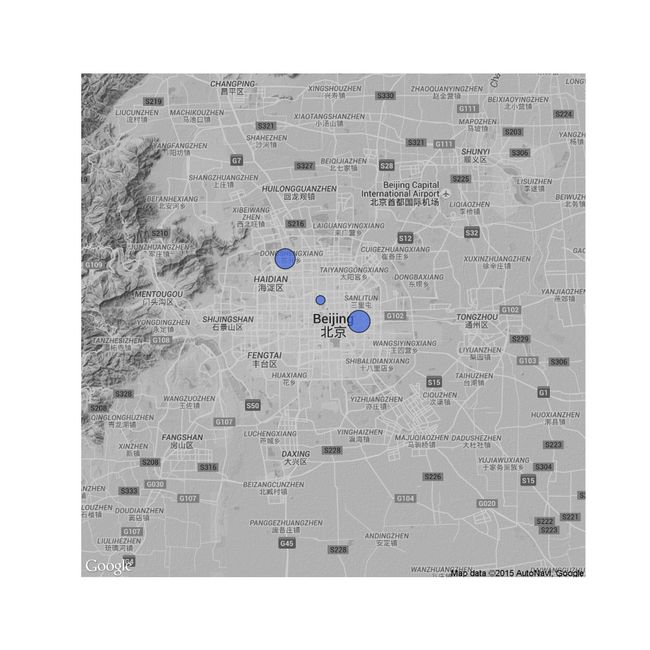
一开始我们定义的API调用函数中还有更多参数可以修改,例如
saturation:-10|lightness:20
如果改为
saturation:-100|lightness:-20
就会得到一张黑白北京地图

