Python实现感知机算法(原始形式、对偶形式)
上一篇文章给出了感知机算法的原理,这里给出Python实现感知机算法的代码:
感知机原始形式实现代码:
# -*- coding: utf-8 -*-
"""
Created on Sun Jul 14 09:48:09 2019
@author: 等等登登-Ande
E-mail:[email protected]

感知机算法原始形式实现(perception)
data为输入数据
label为标签
n为学习率
inter为迭代次数
"""
import numpy as np
import matplotlib.pyplot as plt
def perception(data,label,n,inter):
  raw,col = np.shape(data)
  w = np.random.randn(1,col)
  b = np.random.randn(1)
  x1 = -1
  y1 = (-1/w[:,1])*(np.dot(w[:,0],x1)+b)
  x2 = 2
  y2 = (-1/w[:,1])*(np.dot(w[:,0],x2)+b)
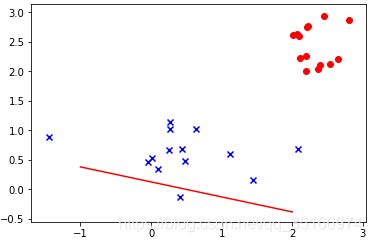
  plt.plot([x1,x2],[y1,y2],color='red')
  plt.scatter(data[1:15,0],data[1:15,1],color='blue',marker='x')
  plt.scatter(data[16:,0],data[16:,1],color='red',marker='o')
  plt.show()
  for times in range(inter):
    for i in range(raw):
      if -label[i-1]*(np.dot(w,(data[:][i-1]))+b) < 0:
        w -= n*label[i-1]*data[:][i-1]
        b -= n*label[i-1]
      elif -label[i-1]*(np.dot(w,(data[:][i-1]))+b) == 0:
        break
  return w,b

if __name__ == '__main__':
  data = np.array([
      [-0.6508, 0.1097],
      [-1.4492, 0.8896],
      [2.0850, 0.6876],
      [0.2626, 1.1476],
      [0.6418, 1.0234],
      [0.2569, 0.6730],
      [1.1155, 0.6043],
      [0.0914, 0.3399],
      [0.0121, 0.5256],
      [-0.0429, 0.4660],
      [0.4340, 0.6870],
      [0.2735, 1.0287],
      [0.4839, 0.4851],
      [0.4089, -0.1267],
      [1.4391, 0.1614],
      [2.9115, 2.1973],
      [2.3654, 2.0475],
      [2.2144, 2.7515],
      [2.2013, 2.0014],
      [2.6483, 2.2183],
      [2.1147, 2.2242],
      [2.7970, 2.8795],
      [2.0625, 2.6366],
      [2.5307, 2.1285],
      [2.2200, 2.7777],
      [2.3957, 2.1076],
      [2.1013, 2.5989],
      [2.4482, 2.9455],
      [2.0149, 2.6192],
      [2.2012, 2.2611]

  ])
  label = np.array([-1, -1, -1, -1, -1, -1, -1, -1, -1, -1, -1, -1, -1, -1, -1, 1, 1, 1, 1, 1, 1, 1, 1, 1, 1, 1, 1, 1, 1, 1])
  w,b = perception(data,label,0.5,1000)
  x1 = -2
  y1 = (-1/w[:,1])*(np.dot(w[:,0],x1)+b)
  x2 = 3
  y2 = (-1/w[:,1])*(np.dot(w[:,0],x2)+b)
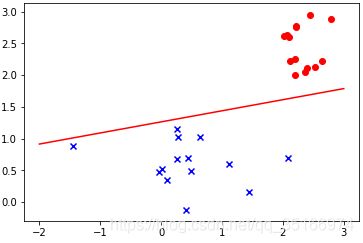
  plt.plot([x1,x2],[y1,y2],color='red')
  plt.scatter(data[1:15,0],data[1:15,1],color='blue',marker='x')
  plt.scatter(data[16:,0],data[16:,1],color='red',marker='o')
  plt.show()
运行效果:
感知机对偶形式实现代码:
# -*- coding: utf-8 -*-
"""
Created on Wed Jul 17 10:53:30 2019
@author: 等等登登-Ande
E-mail:[email protected]

感知机算法对偶形式实现(perception)
data为输入数据
label为标签
n为学习率
inter为迭代次数
"""

import numpy as np
import matplotlib.pyplot as plt
def perception_an(data,label,n,inter):
   #初始化参数
   a = np.random.randn(len(data))
   b = 0
   Gram = np.dot(data,data.T)
   for k in range(inter):
     for i in range(len(data)):
       tmp = 0
       for j in range(len(data)):
         tmp += a[j]*label[j]*Gram[i][j]
       tmp += b
       if (label[i]*tmp <= 0):
         a[i] += n
         b += n*label[i]
   w = 0
   for i in range(len(a)):
     w += a[i]*label[i]*data[i,:]
   return w,b

if __name__ == '__main__':
  data = np.array([
      [-0.6508, 0.1097],
      [-1.4492, 0.8896],
      [2.0850, 0.6876],
      [0.2626, 1.1476],
      [0.6418, 1.0234],
      [0.2569, 0.6730],
      [1.1155, 0.6043],
      [0.0914, 0.3399],
      [0.0121, 0.5256],
      [-0.0429, 0.4660],
      [0.4340, 0.6870],
      [0.2735, 1.0287],
      [0.4839, 0.4851],
      [0.4089, -0.1267],
      [1.4391, 0.1614],
      [2.9115, 2.1973],
      [2.3654, 2.0475],
      [2.2144, 2.7515],
      [2.2013, 2.0014],
      [2.6483, 2.2183],
      [2.1147, 2.2242],
      [2.7970, 2.8795],
      [2.0625, 2.6366],
      [2.5307, 2.1285],
      [2.2200, 2.7777],
      [2.3957, 2.1076],
      [2.1013, 2.5989],
      [2.4482, 2.9455],
      [2.0149, 2.6192],
      [2.2012, 2.2611]

  ])
  label = np.array([-1, -1, -1, -1, -1, -1, -1, -1, -1, -1, -1, -1, -1, -1, -1, 1, 1, 1, 1, 1, 1, 1, 1, 1, 1, 1, 1, 1, 1, 1])
  w,b = perception_an(data,label,0.5,1)
  x1 = -2
  y1 = (-1/w[1])*(np.dot(w[0],x1)+b)
  x2 = 3
  y2 = (-1/w[1])*(np.dot(w[0],x2)+b)
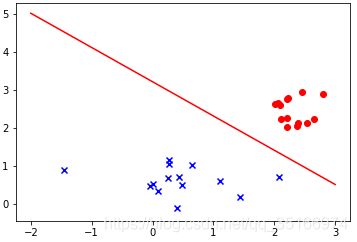
  plt.plot([x1,x2],[y1,y2],color='red')
  plt.scatter(data[1:15,0],data[1:15,1],color='blue',marker='x')
  plt.scatter(data[16:,0],data[16:,1],color='red',marker='o')
  plt.show()
运行效果:
上面就是python实现感知机的代码,希望对大家有所帮助~


